Question
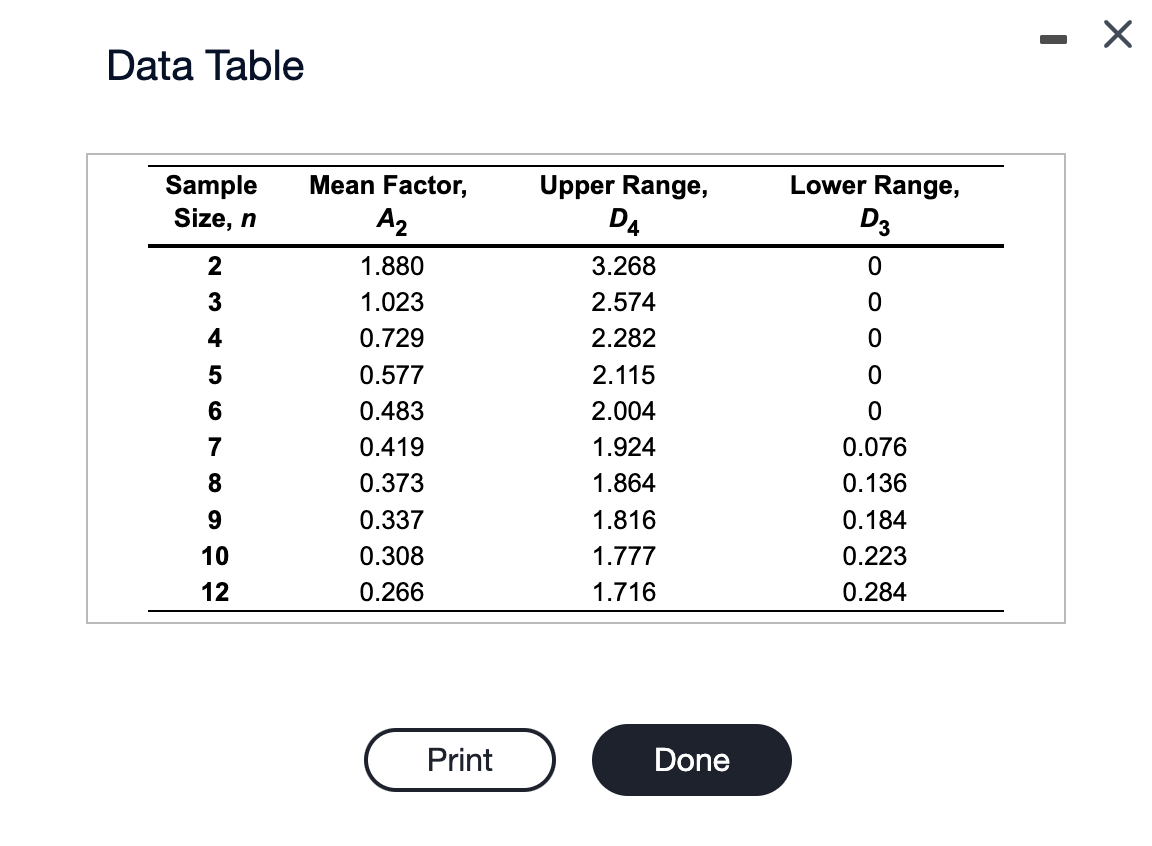
Data Table Sample Size, n Mean Factor, Upper Range, Lower Range, A2 D4 D3 2 1.880 3.268 0 3 1.023 2.574 0 4 0.729


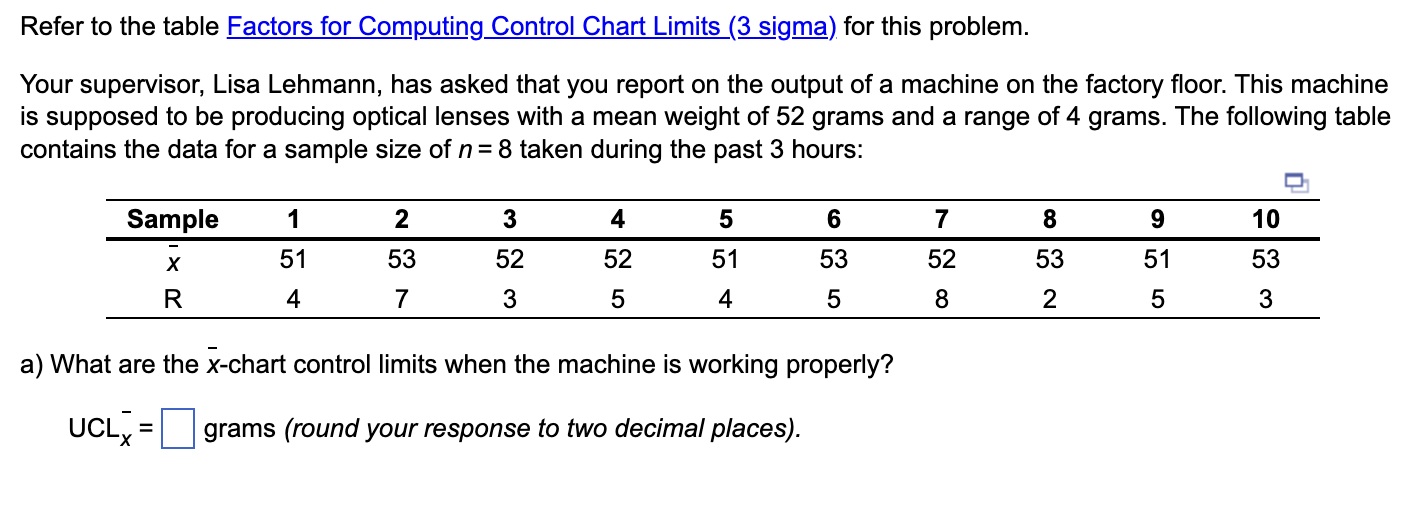
Data Table Sample Size, n Mean Factor, Upper Range, Lower Range, A2 D4 D3 2 1.880 3.268 0 3 1.023 2.574 0 4 0.729 2.282 0 5 0.577 2.115 0 6 0.483 2.004 0 7 0.419 1.924 0.076 8 0.373 1.864 0.136 9 0.337 1.816 0.184 10 0.308 1.777 0.223 12 0.266 1.716 0.284 Print Done Refer to the table Factors for Computing Control Chart Limits (3 sigma) for this problem. Your supervisor, Lisa Lehmann, has asked that you report on the output of a machine on the factory floor. This machine is supposed to be producing optical lenses with a mean weight of 52 grams and a range of 4 grams. The following table contains the data for a sample size of n = 8 taken during the past 3 hours: Sample 1 2 3 4 5 6 7 X 51 53 52 52 51 53 52 R 4 7 3 5 4 5 8 a) What are the x-chart control limits when the machine is working properly? UCL X = grams (round your response to two decimal places). 882 9 10 53 51 53 5 LO 3
Step by Step Solution
There are 3 Steps involved in it
Step: 1

Get Instant Access to Expert-Tailored Solutions
See step-by-step solutions with expert insights and AI powered tools for academic success
Step: 2

Step: 3

Ace Your Homework with AI
Get the answers you need in no time with our AI-driven, step-by-step assistance
Get StartedRecommended Textbook for
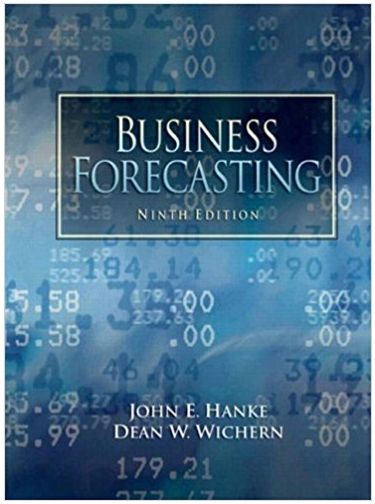
Business Forecasting
Authors: John E. Hanke, Dean Wichern
9th edition
132301202, 978-0132301206
Students also viewed these General Management questions
Question
Answered: 1 week ago
Question
Answered: 1 week ago
Question
Answered: 1 week ago
Question
Answered: 1 week ago
Question
Answered: 1 week ago
Question
Answered: 1 week ago
Question
Answered: 1 week ago
Question
Answered: 1 week ago
Question
Answered: 1 week ago
Question
Answered: 1 week ago
Question
Answered: 1 week ago
Question
Answered: 1 week ago
Question
Answered: 1 week ago
Question
Answered: 1 week ago
Question
Answered: 1 week ago
Question
Answered: 1 week ago
Question
Answered: 1 week ago
Question
Answered: 1 week ago
Question
Answered: 1 week ago
Question
Answered: 1 week ago
Question
Answered: 1 week ago
View Answer in SolutionInn App


