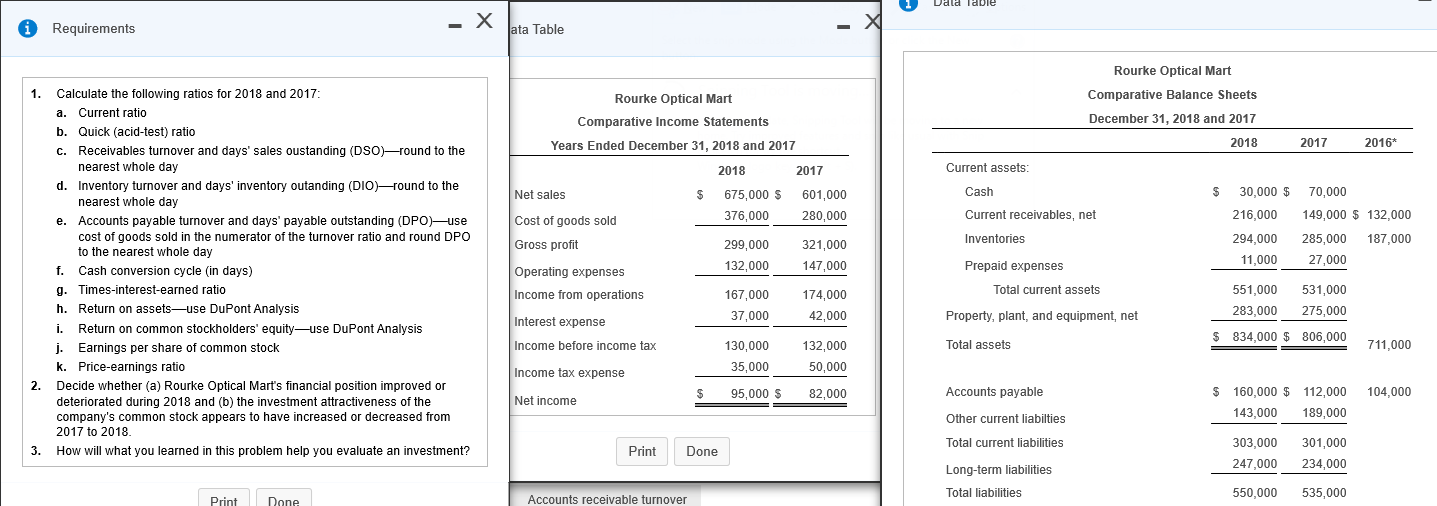
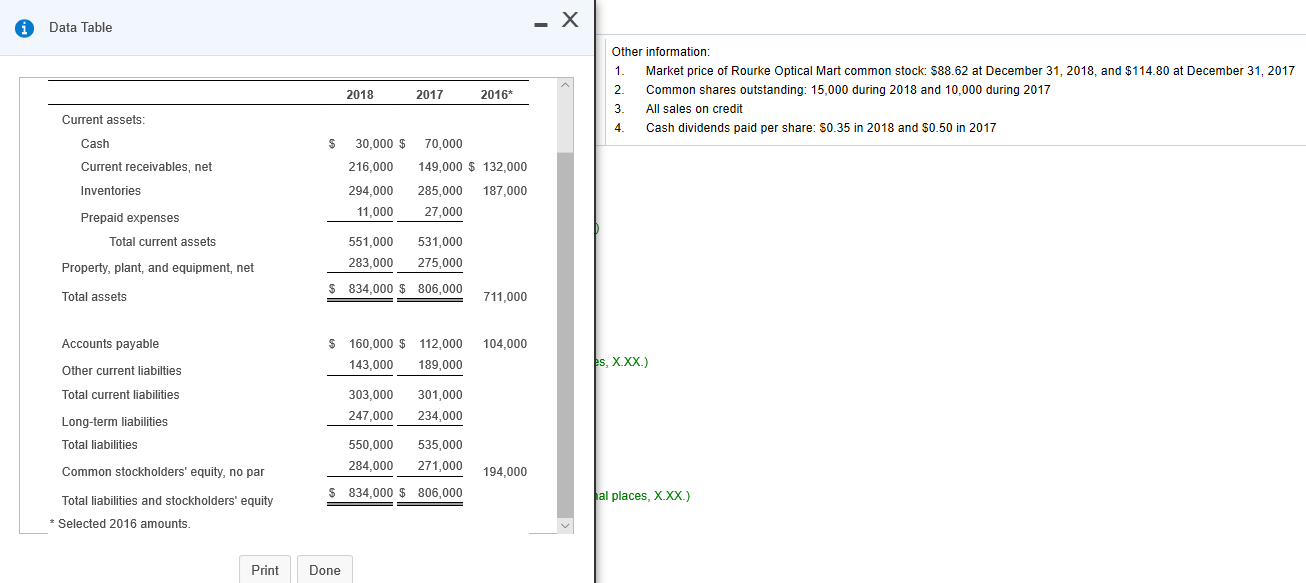
Data Table - X - 0 Requirements - X ata Table 1. Rourke Optical Mart Comparative Income Statements Years Ended December 31, 2018 and 2017 Rourke Optical Mart Comparative Balance Sheets December 31, 2018 and 2017 2018 2017 2016* 2018 2017 Current assets: Net sales $ 675,000 $ 376,000 601,000 280,000 Cost of goods sold Gross profit Cash Current receivables, net Inventories $ 30,000 $ 70,000 216,000 149,000 $ 132,000 294,000 285,000 187,000 11,000 27,000 Calculate the following ratios for 2018 and 2017: a. Current ratio b. Quick (acid-test) ratio c. Receivables turnover and days' sales oustanding (DSO)round to the nearest whole day d. Inventory turnover and days' inventory outanding (DIO)round to the nearest whole day e. Accounts payable turnover and days' payable outstanding (DPO)use cost of goods sold in the numerator of the turnover ratio and round DPO to the nearest whole day f. Cash conversion cycle (in days) g. Times-interest-earned ratio h. Return on assets-use DuPont Analysis i. Return on common stockholders' equityuse DuPont Analysis i. Earnings per share of common stock k. Price-earnings ratio Decide whether (a) Rourke Optical Mart's financial position improved or deteriorated during 2018 and (b) the investment attractiveness of the company's common stock appears to have increased or decreased from 2017 to 2018 How will what you learned in this problem help you evaluate an investment? 321,000 147,000 Operating expenses Income from operations 299,000 132,000 167,000 37,000 Prepaid expenses Total current assets 174,000 42,000 551,000 283,000 531,000 275,000 Property, plant, and equipment, net Interest expense Income before income tax $ 834,000 $ 806,000 Total assets 711,000 130,000 35,000 132,000 50,000 Income tax expense 2. $ 95,000 $ 82,000 Accounts payable 104,000 Net income $ 160,000 $ 112,000 143,000 189,000 Other current liabilties Total current liabilities 3. Print Done 303,000 247,000 301,000 234,000 Long-term liabilities Total liabilities 550,000 Accounts receivable turnover Print 535,000 Done - X Data Table 2018 2017 2016* Other information: 1. Market price of Rourke Optical Mart common stock: 588.62 at December 31, 2018, and $114.80 at December 31, 2017 2. Common shares outstanding: 15,000 during 2018 and 10,000 during 2017 3. All sales on credit 4. Cash dividends paid per share: 50.35 in 2018 and $0.50 in 2017 Current assets: Cash Current receivables, net $ 30,000 $ 70,000 216,000 149,000 $ 132,000 294,000 285,000 187,000 11,000 27,000 Inventories Prepaid expenses Total current assets 551,000 283,000 531,000 275,000 Property, plant, and equipment, net $ 834,000 $ 806,000 Total assets 711,000 Accounts payable $ 160,000 $ 112,000 104,000 143.000 189,000 es, X.XX.) Other current liabilties Total current liabilities 303,000 247,000 301,000 234,000 Long-term liabilities Total liabilities 550,000 284.000 535,000 271,000 Common stockholders' equity, no par 194,000 $ 834,000 $ 806,000 al places, X.XX.) Total liabilities and stockholders' equity * Selected 2016 amounts. Print Done