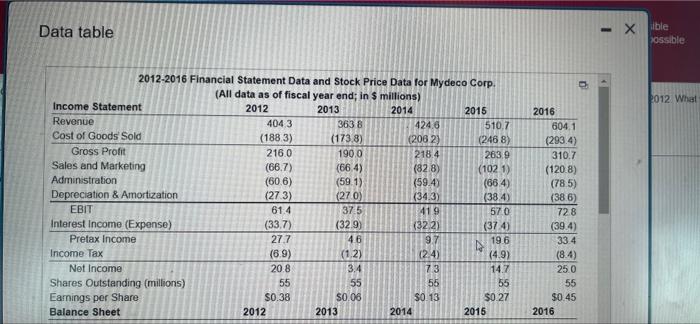
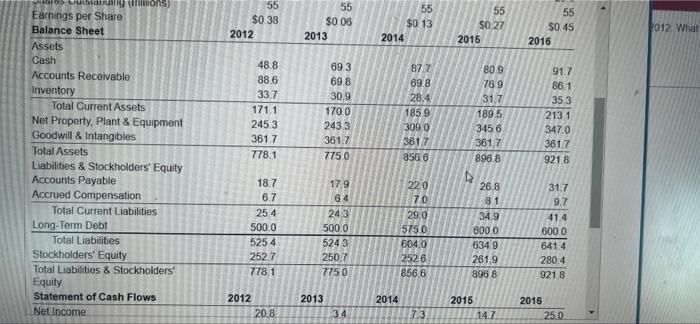
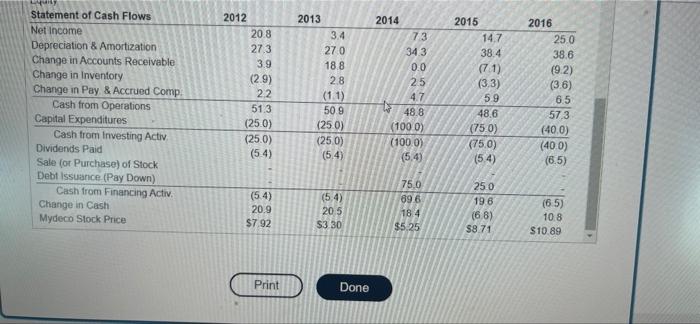
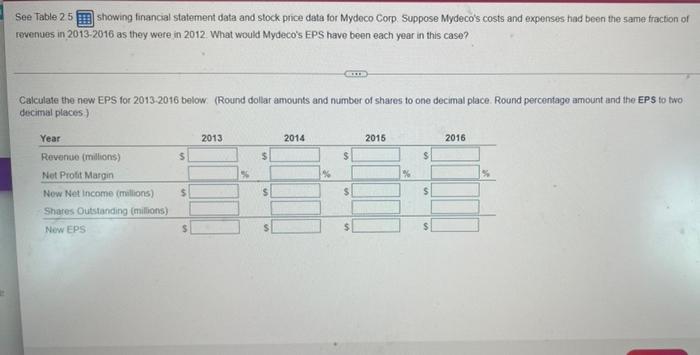
Data table - x ble ossible 2012 What 2012-2016 Financial Statement Data and Stock Price Data for Mydeco Corp. (All data as of fiscal year end; in $ millions) Income Statement 2012 2013 2014 2015 Revenue 4043 3638 424.8 510.7 Cost of Goods Sold (1883) (173.8) (2062) (2468) Gross Profit 216.0 1900 218.4 2639 Sales and Marketing (667) (664) (828) (1021) Administration (606) (591) (59.4) (664) Depreciation & Amortization (273) (270) (34.3) (384) EBIT 61.4 375 419 570 Interest Income (Expense) (33.7) (329) (32.2) (374) Pretax Income 27.7 46 97 196 Income Tax (6.9) (12) 12.4) (4.9) Net Income 20.8 3.4 73 14.7 Shares Outstanding (millions) 55 55 55 55 Earnings per Share $0.38 $0.08 SO 13 $0.27 Balance Sheet 2012 2013 2014 2015 2016 6041 (293) 310.7 (1208) (785) (386) 728 (39.4) 33.4 (8.4) 250 55 S0.45 2016 55 $0.38 2012 55 SO 06 2013 55 $0 13 2014 w 55 S0.27 2015 55 $0.45 2016 2012 What O bagons) Earnings per Share Balance Sheet Assets Cash Accounts Receivable Inventory Total Current Assets Net Property, Plant & Equipment Goodwill & Intangibles Total Assets Liabilities & Stockholders' Equity Accounts Payable Accrued Compensation Total Current Liabilities Long-Term Debt Total Liabilities Stockholders' Equity Total Liabilities & Stockholders Equity Statement of Cash Flows Net Income 48.8 886 33.7 171.1 2453 361.7 778.1 69.3 698 30.9 170 0 2433 361.7 7750 87.7 89.8 28.4 1859 3090 3617 856 6 80.9 769 31.7 1895 3456 361,7 896.8 91.7 86.1 353 2131 3470 361.7 9218 220 18.7 6.7 25.4 500.0 5254 2527 778.1 179 6.4 243 500.0 5243 250.7 7750 70 29,0 5750 6040 2526 856.6 26.8 81 34.9 8000 6349 261,9 8968 317 9.7 41.4 6000 641.4 280.4 921.8 2013 2014 2012 20.8 34 2015 14.7 2016 25.0 7.3 2013 3.4 270 18.8 2.8 Statement of Cash Flows Net Income Depreciation & Amortization Change in Accounts Receivable Change in Inventory Change in Pay & Accrued Comp Cash from Operations Capital Expenditures Cash from Investing Activ Dividends Paid Sale (or Purchase) of Stock Debt Issuance (Pay Down) Cash from Financing Activ. Change in Cash Mydeco Stock Price 2012 208 27.3 3.9 (2.9) 22 513 (25.0) (25.0) (54) 2014 73 34 3 0.0 25 4.7 48.8 (1000) (1000) (5.4) 2015 14.7 38.4 (71) (3.3) 59 48.6 (750) 2016 250 38.6 (9.2) (3.6) 6.5 57.3 (400) (400) (6.5) 50 9 (250) (250) (5.4) (750) (5.4) 75.0 (54) 20.9 $7.92 (54) 20.5 $3 30 89 6 18.4 $5.25 25 0 196 (66) $8 71 (6.5) 108 $10.89 Print Done See Table 25 showing financial statement data and stock price data for Mydeco Corp. Suppose Mydeco's costs and expenses had been the same fraction of revenues in 2013-2016 as they were in 2012 What would Mydeco's EPS have been each year in this caso? CE Calculate the new EPS for 2013 2016 below. (Round dollar amounts and number of shares to one decimal place. Round percentage amount and the EPS to two decimal places) 2013 2014 2015 2016 $ $ $ % % Year Revenue (millions) Net Profit Margin Now Net Income (millions) Shares Outstanding millions) New EPS $ $ $ $ s $ $