Answered step by step
Verified Expert Solution
Question
1 Approved Answer
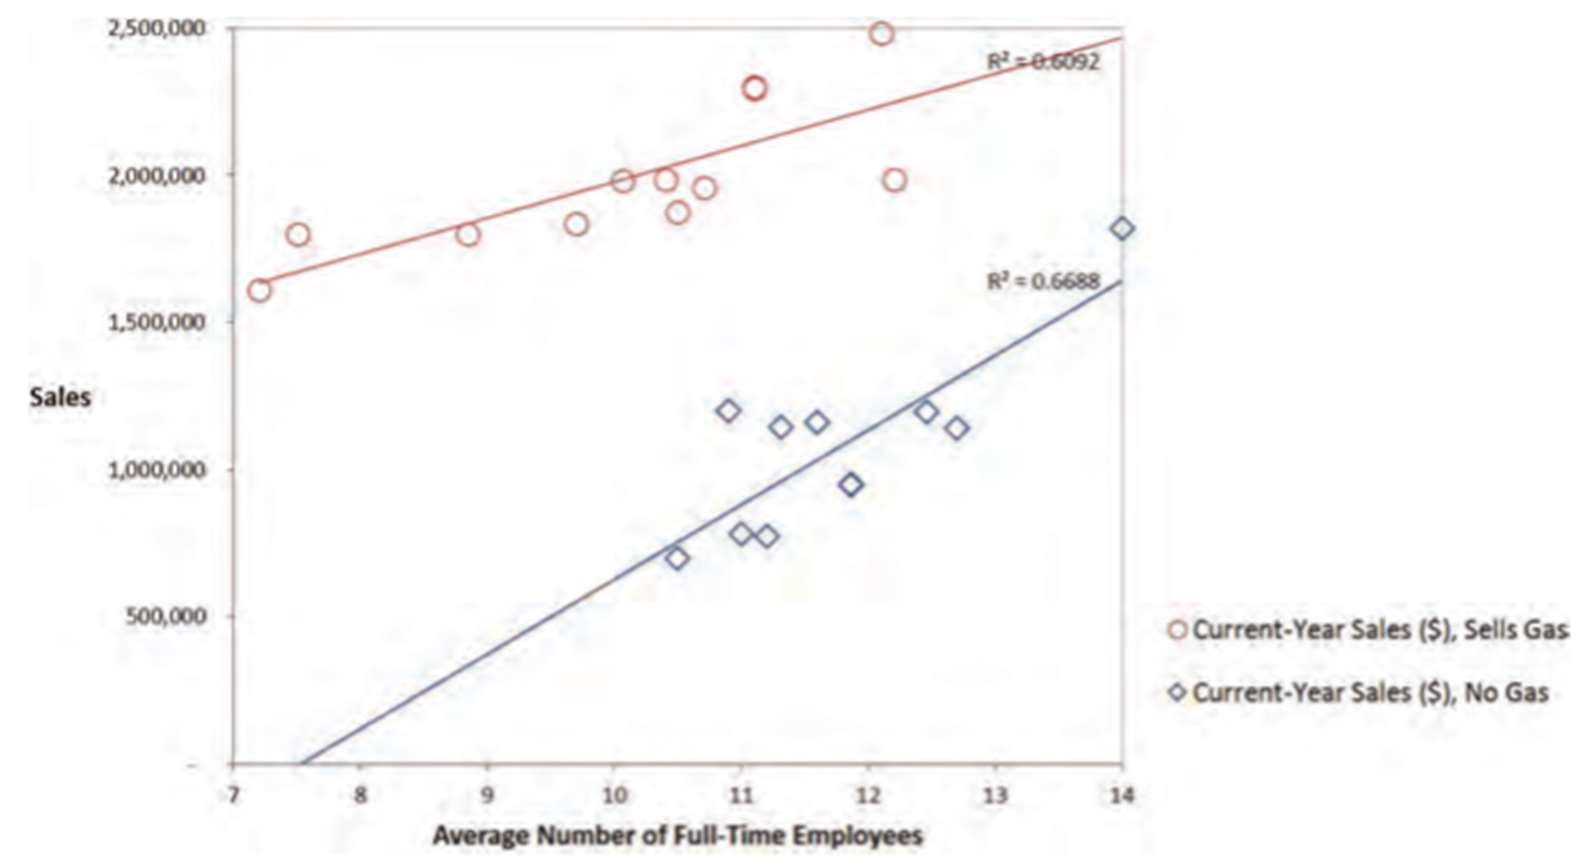
Data Visualization Given the sales data provided on the 23 stores in Table 1, the senior auditor decided it would be beneficial to create visualizations
Data Visualization
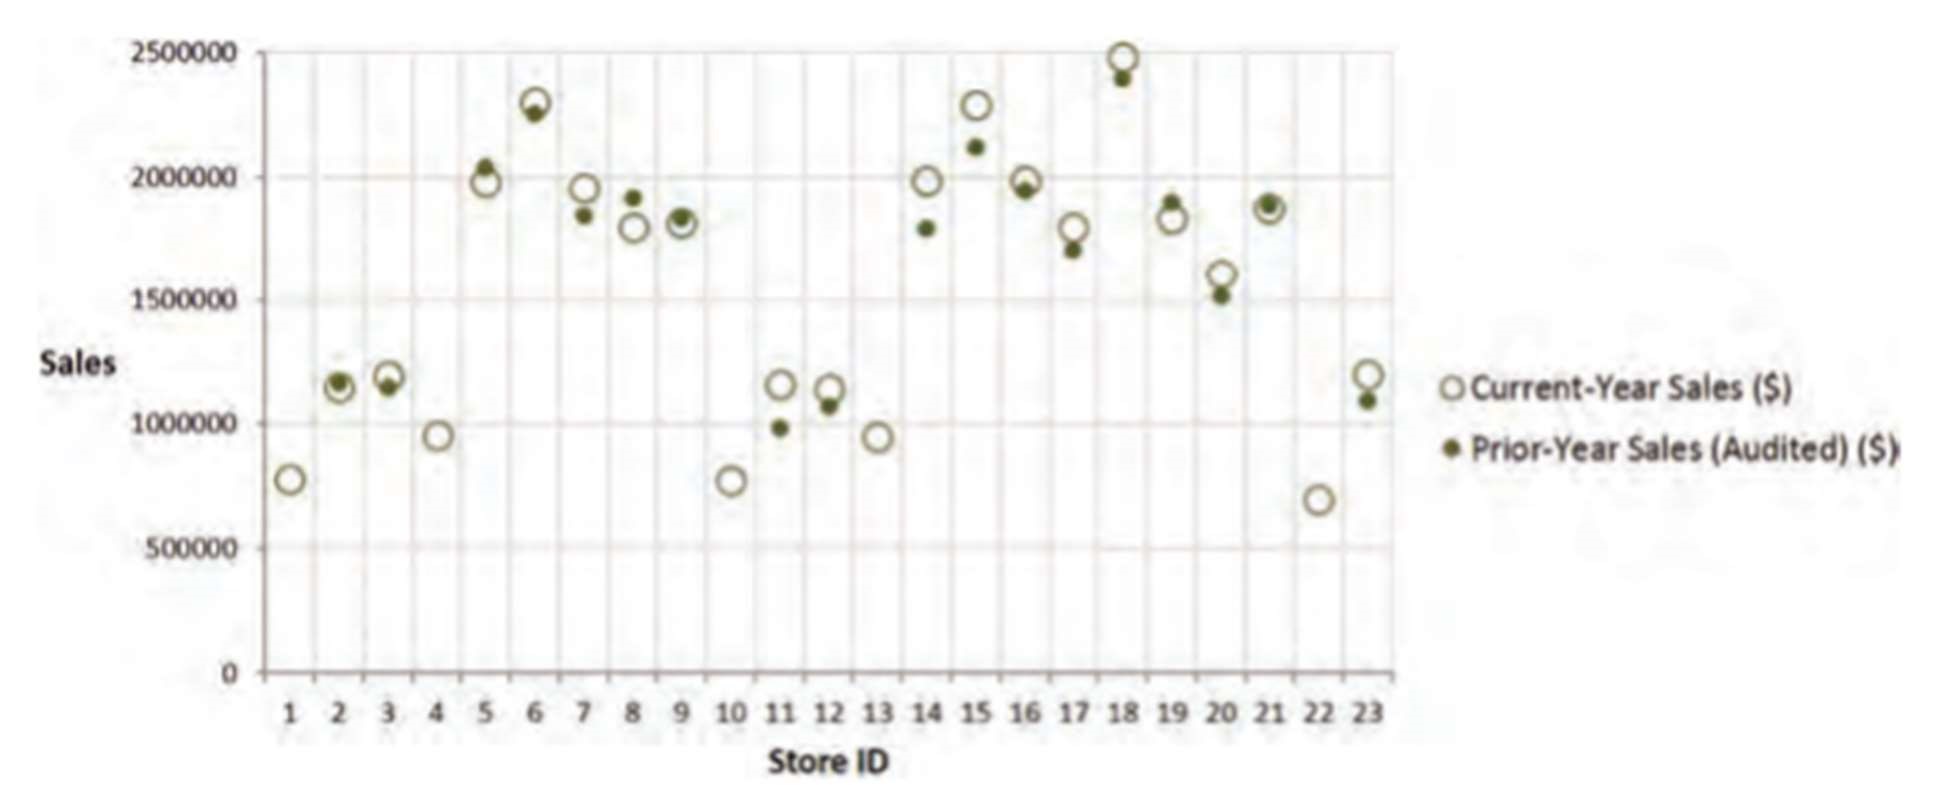
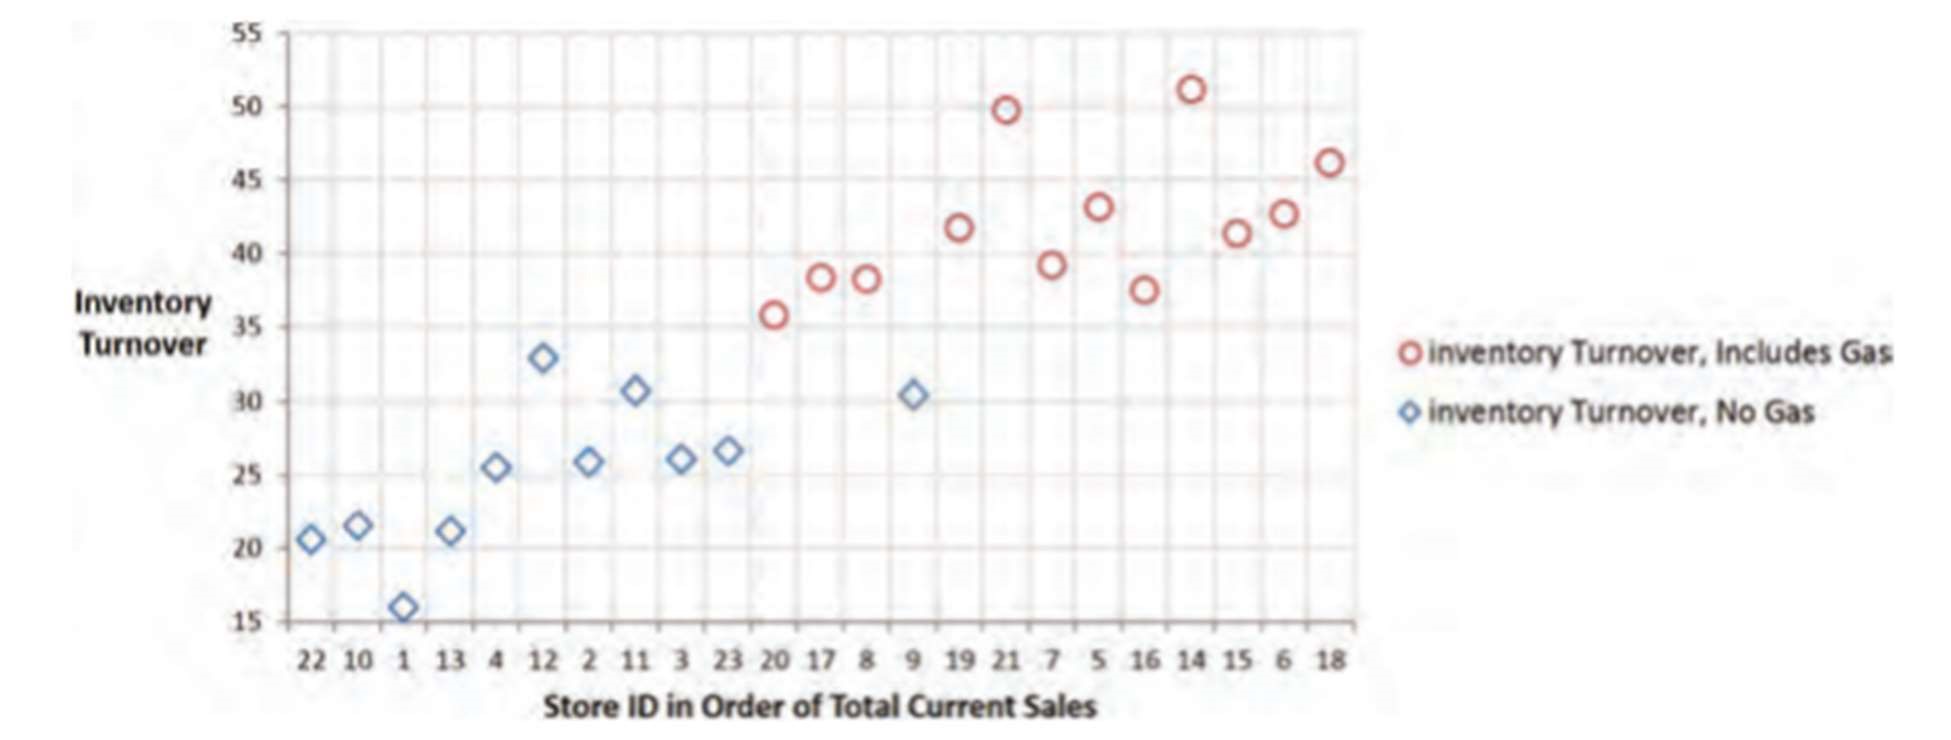
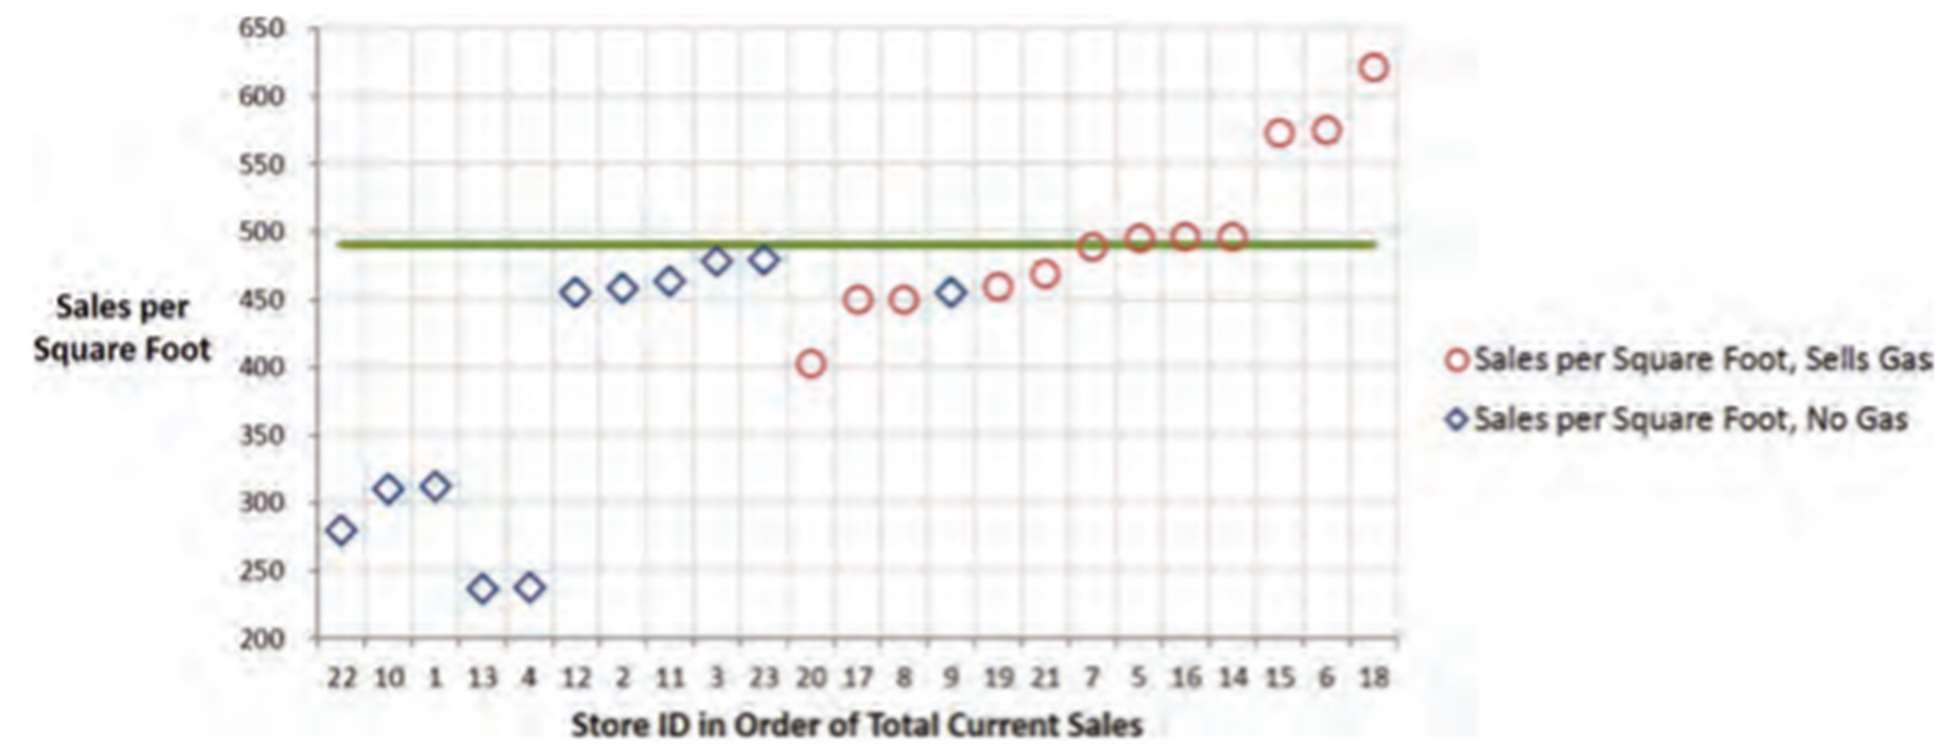
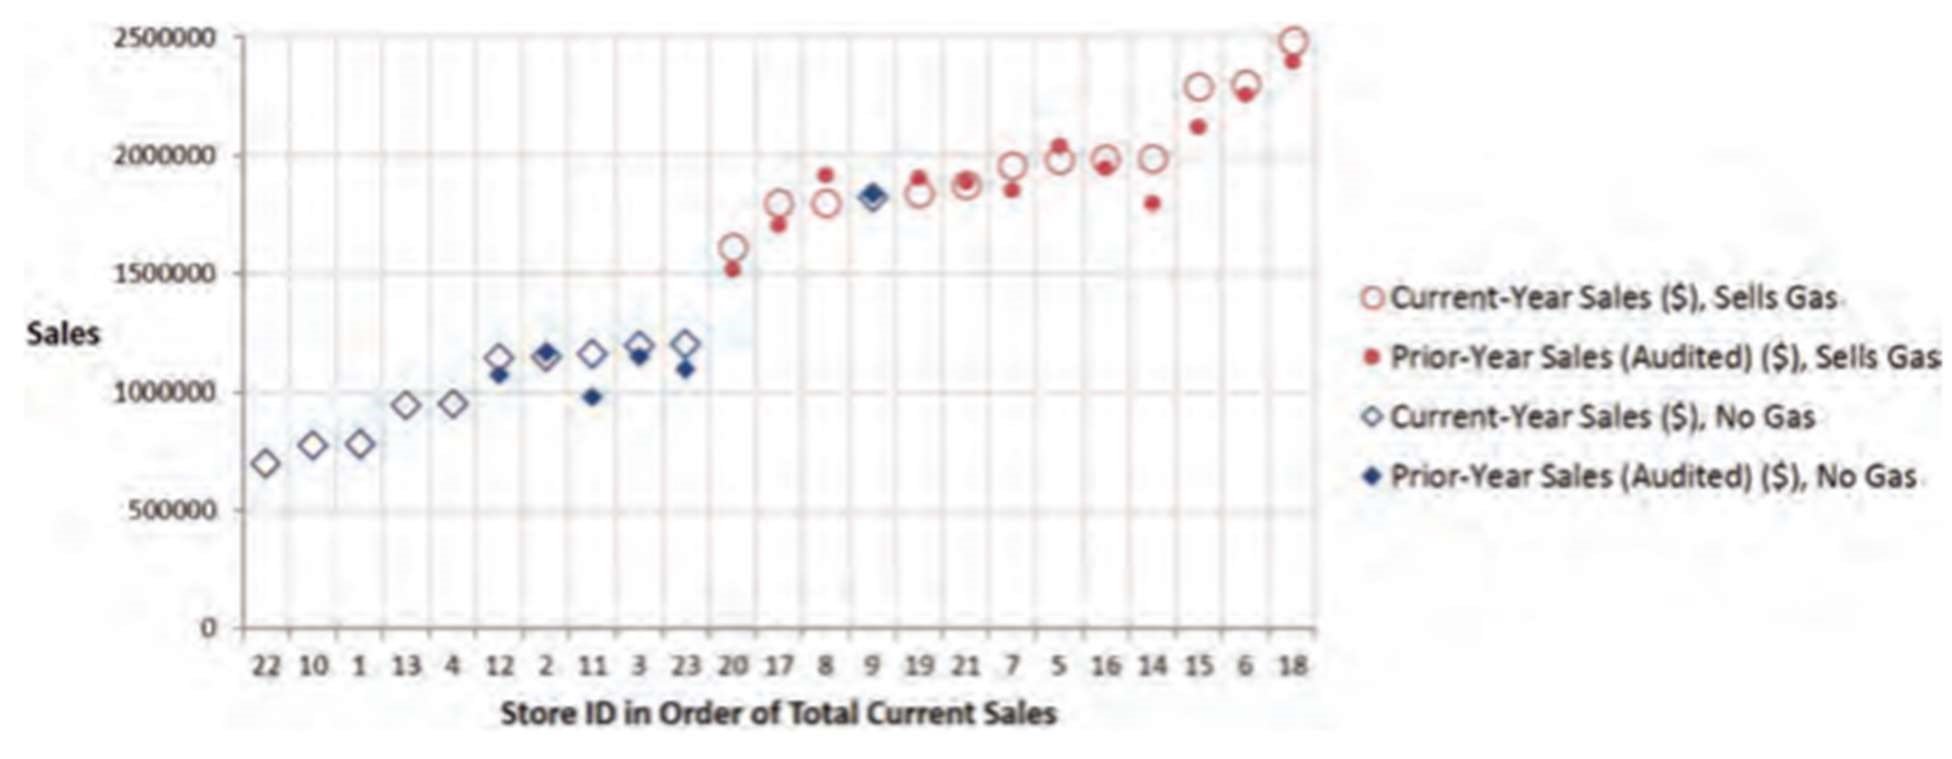
Given the sales data provided on the 23 stores in Table 1, the senior auditor decided it would be beneficial to create visualizations to find additional information underlying the data. Thus, the senior auditor put together the five charts below.
Figure 1: Quicky Stores, Current and Prior Year Sales in Store ID Order as Presented
Store Sales, Current and Prior Years
Step by Step Solution
There are 3 Steps involved in it
Step: 1

Get Instant Access to Expert-Tailored Solutions
See step-by-step solutions with expert insights and AI powered tools for academic success
Step: 2

Step: 3

Ace Your Homework with AI
Get the answers you need in no time with our AI-driven, step-by-step assistance
Get Started


