Answered step by step
Verified Expert Solution
Link Copied!

Question

1 Approved Answer

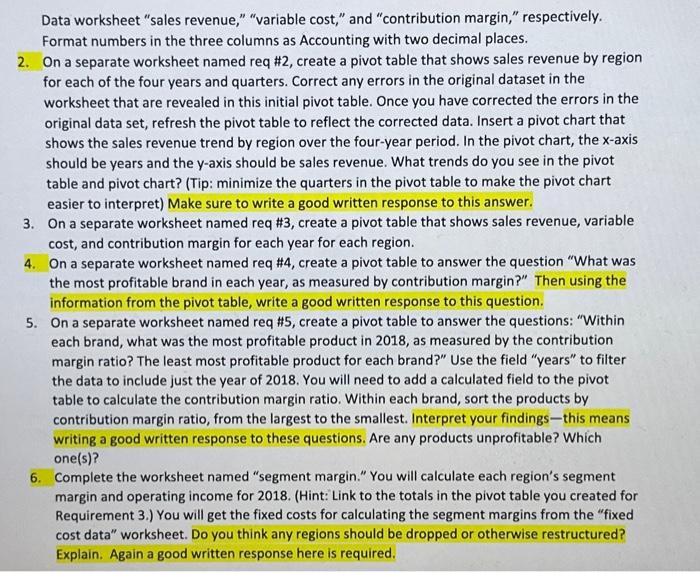
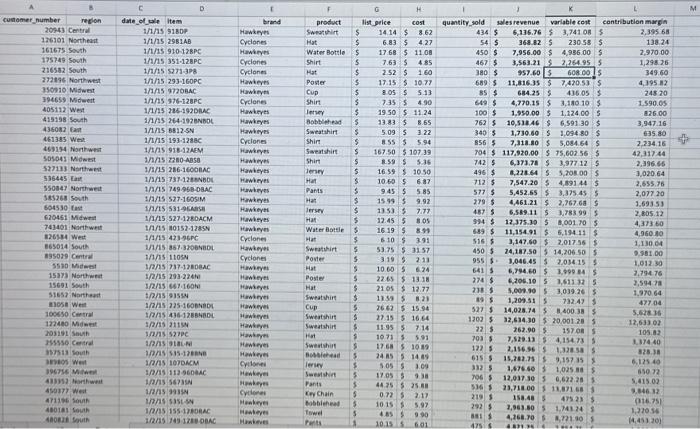
Data worksheet sales revenue, variable cost, and contribution margin, respectively. Format numbers in the three columns as Accounting with two decimal places. 2. On a

image text in transcribed
Data worksheet "sales revenue," "variable cost," and "contribution margin," respectively. Format numbers in the three columns as Accounting with two decimal places. 2. On a separate worksheet named req #2, create a pivot table that shows sales revenue by region for each of the four years and quarters. Correct any errors in the original dataset in the worksheet that are revealed in this initial pivot table. Once you have corrected the errors in the original data set, refresh the pivot table to reflect the corrected data. Insert a pivot chart that shows the sales revenue trend by region over the four-year period. In the pivot chart, the x-axis should be years and the y-axis should be sales revenue. What trends do you see in the pivot table and pivot chart? (Tip: minimize the quarters in the pivot table to make the pivot chart easier to interpret) Make sure to write a good written response to this answer. 3. On a separate worksheet named req #3, create a pivot table that shows sales revenue, variable cost, and contribution margin for each year for each region. 4. On a separate worksheet named req \#4, create a pivot table to answer the question "What was the most profitable brand in each year, as measured by contribution margin?" Then using the information from the pivot table, write a good written response to this question. 5. On a separate worksheet named req #5, create a pivot table to answer the questions: "Within each brand, what was the most profitable product in 2018 , as measured by the contribution margin ratio? The least most profitable product for each brand?" Use the field "years" to filter the data to include just the year of 2018. You will need to add a calculated field to the pivot table to calculate the contribution margin ratio. Within each brand, sort the products by contribution margin ratio, from the largest to the smallest. Interpret your findings - this means writing a good written response to these questions. Are any products unprofitable? Which one(s)? 6. Complete the worksheet named "segment margin." You will calculate each region's segment margin and operating income for 2018. (Hint: Link to the totals in the pivot table you created for Requirement 3.) You will get the fixed costs for calculating the segment margins from the "fixed cost data" worksheet. Do you think any regions should be dropped or otherwise restructured? Explain. Again a good written response here is required

Step by Step Solution

There are 3 Steps involved in it

Step: 1

blur-text-image

Get Instant Access to Expert-Tailored Solutions

See step-by-step solutions with expert insights and AI powered tools for academic success

Step: 2

blur-text-image

Step: 3

blur-text-image

Ace Your Homework with AI

Get the answers you need in no time with our AI-driven, step-by-step assistance

Get Started

Recommended Textbook for

More Books

Students also viewed these Accounting questions