Answered step by step
Verified Expert Solution
Link Copied!

Question

1 Approved Answer

DataForNumber7R.xls - Compatibility Mode - Saved to my Mac Formulas Data Review View Share Comments AutoSave OFF Svo- Home Insert Draw Page Layout | 826
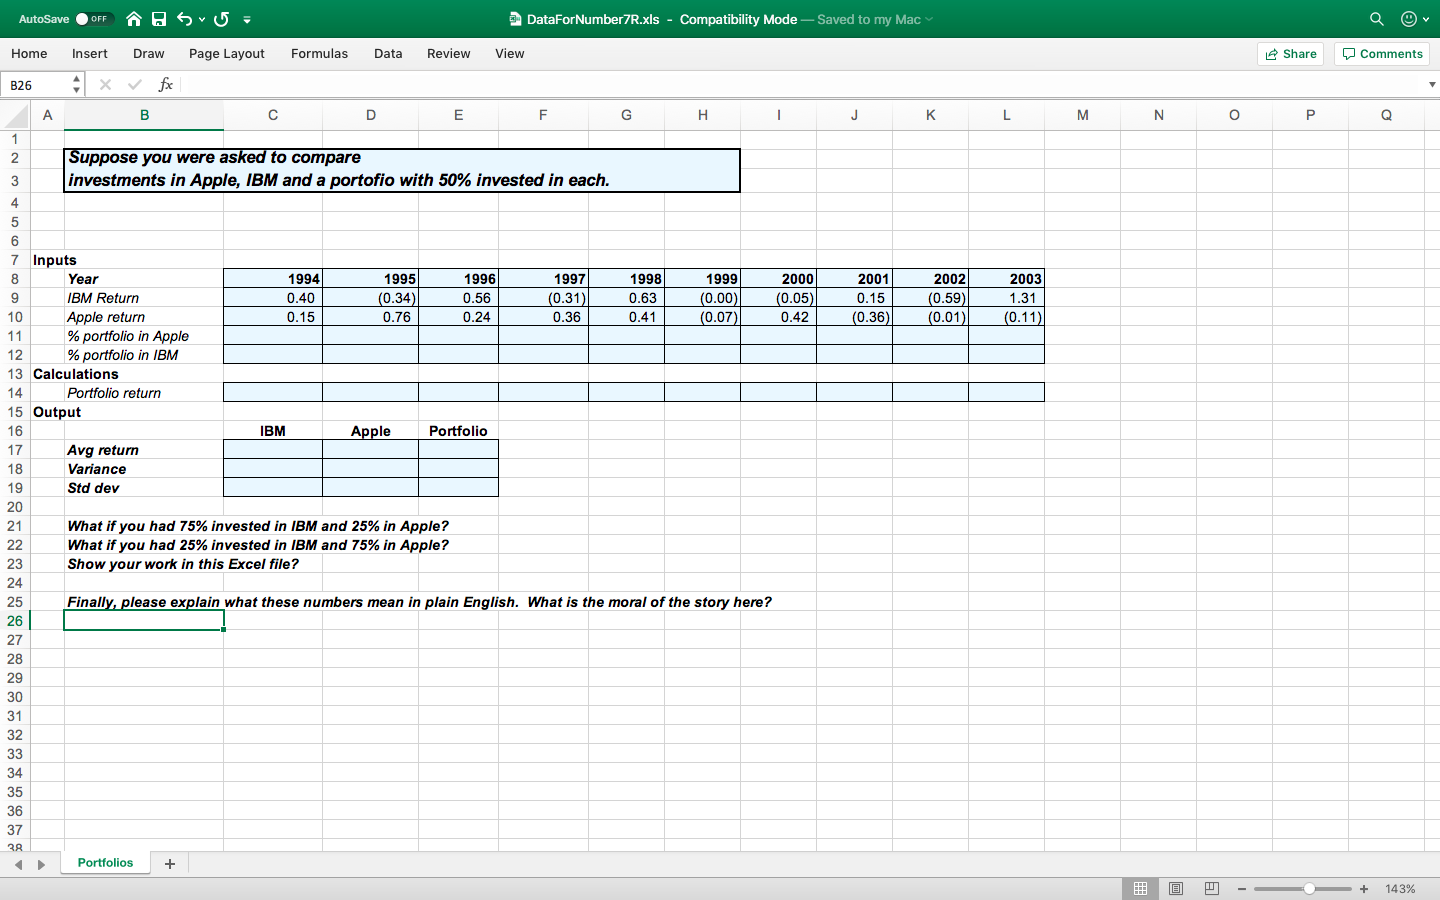
image text in transcribed

DataForNumber7R.xls - Compatibility Mode - Saved to my Mac Formulas Data Review View Share Comments AutoSave OFF Svo- Home Insert Draw Page Layout | 826 A x v fx A B C D E F G H I J K L M N O P Q Suppose you were asked to compare investments in Apple, IBM and a portofio with 50% invested in each. 1994 0.40 0.15 1995 (0.34) 0.76 1996 0.56 0.24 1997 (0.31) 0.36 1998 0.63 0.41 1999 (0.00) (0.07 2000 (0.05) 0.42 2001 0.15 (0.36)| 2002 (0.59) (0.01)| 2003 1.31 (0.11) 7 Inputs Year IBM Return Apple return % portfolio in Apple % portfolio in IBM 13 Calculations Portfolio return 15 Output IBM Apple Portfolio Avg return Variance Std dev What if you had 75% invested in IBM and 25% in Apple? What if you had 25% invested in IBM and 75% in Apple? Show your work in this Excel file? Finally, please explain what these numbers mean in plain English. What is the moral of the story here? Portfolios + 90 - - +

Step by Step Solution

There are 3 Steps involved in it

Step: 1

blur-text-image

Get Instant Access to Expert-Tailored Solutions

See step-by-step solutions with expert insights and AI powered tools for academic success

Step: 2

blur-text-image

Step: 3

blur-text-image

Ace Your Homework with AI

Get the answers you need in no time with our AI-driven, step-by-step assistance

Get Started

Recommended Textbook for

More Books

Students also viewed these Finance questions