Question: Dataset A: This dataset contains input/output data generated from a noisy polynomial model: y = f(x) + , where x 1 = [2,2] and
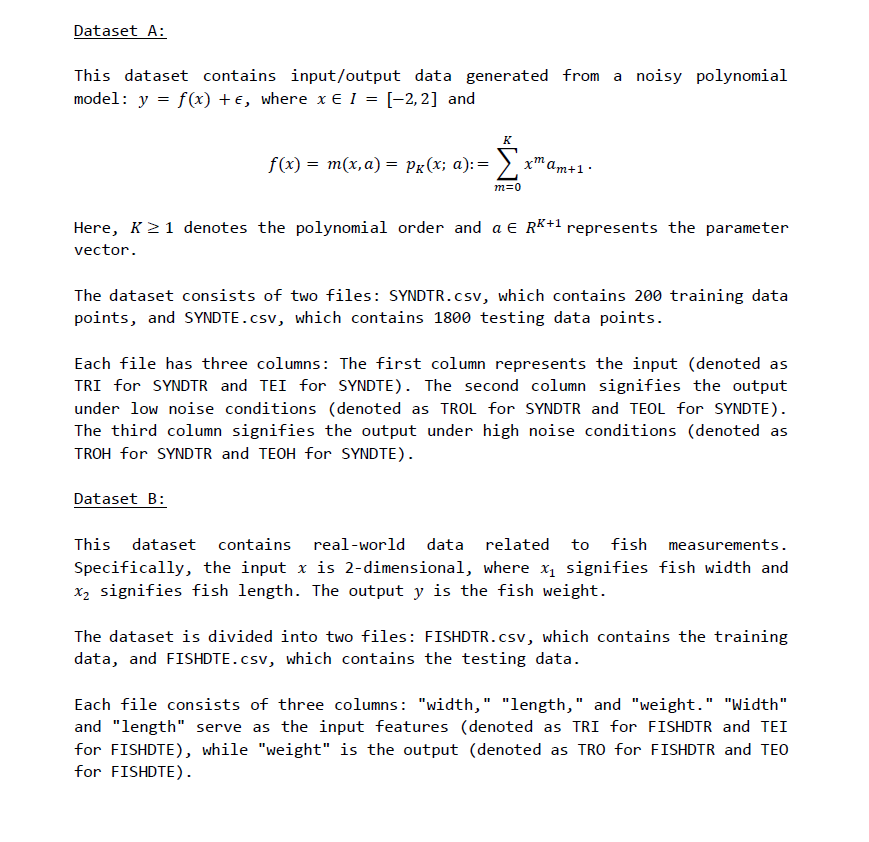
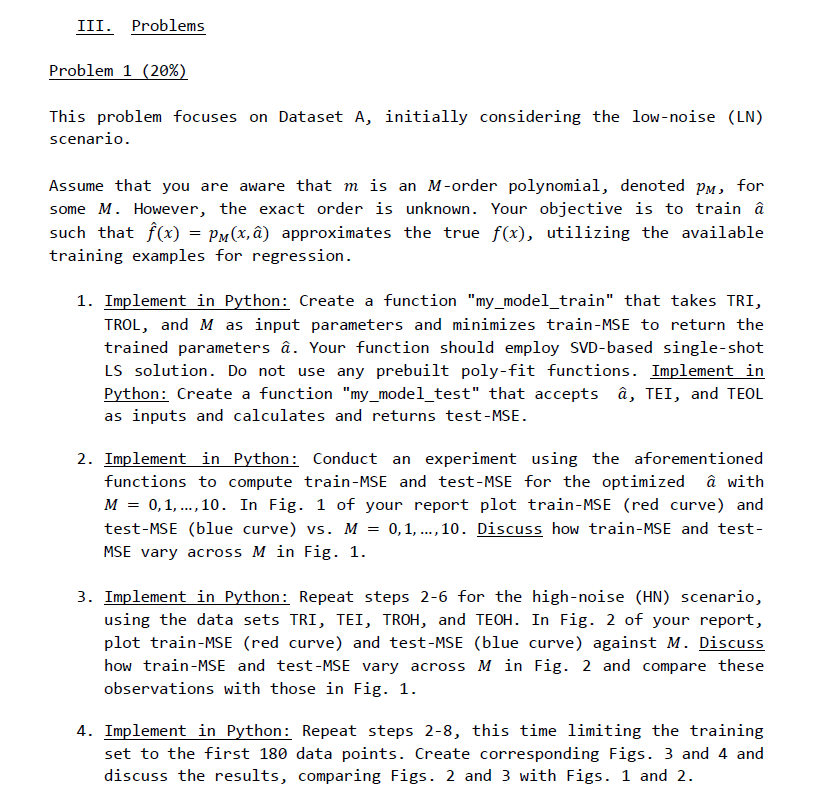
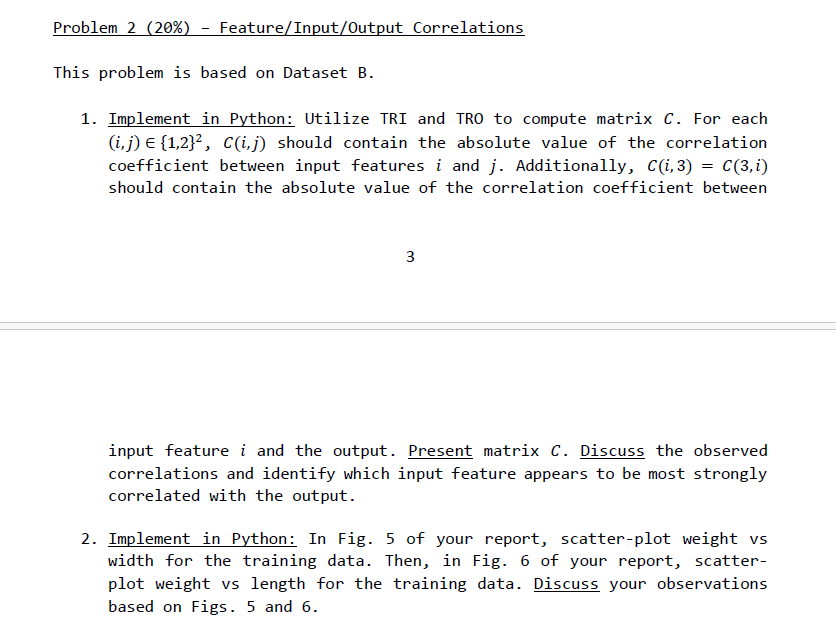
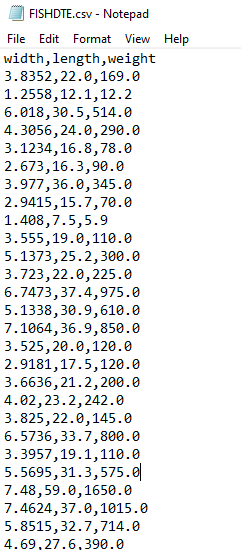
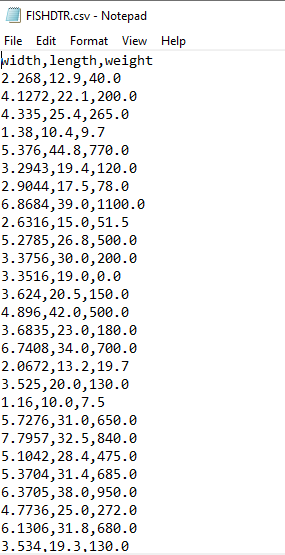
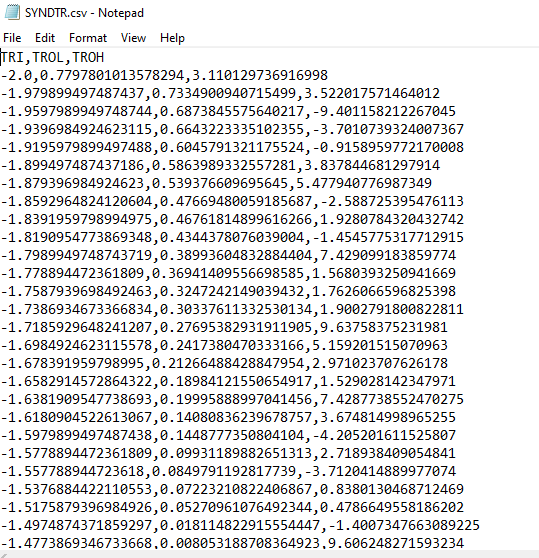
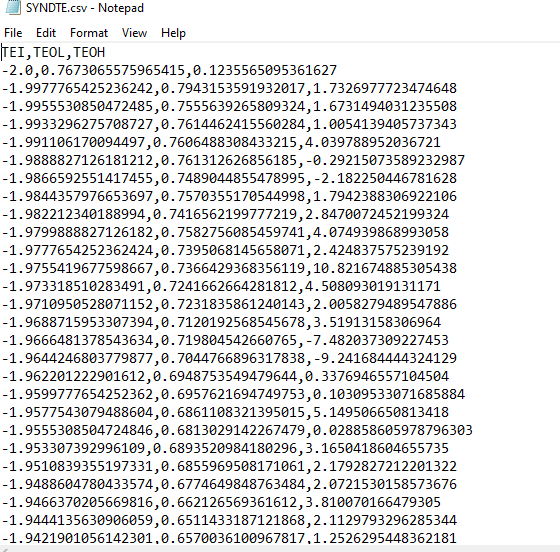
Dataset A: This dataset contains input/output data generated from a noisy polynomial model: y = f(x) + , where x 1 = [2,2] and K f(x) = m(x,a) = px(x; a):= [: m=0 xmam+1. Here, K 1 denotes the polynomial order and a RK+ represents the parameter vector. The dataset consists of two files: SYNDTR.csv, which contains 200 training data points, and SYNDTE.csv, which contains 1800 testing data points. Dataset B: Each file has three columns: The first column represents the input (denoted as TRI for SYNDTR and TEI for SYNDTE). The second column signifies the output under low noise conditions (denoted as TROL for SYNDTR and TEOL for SYNDTE). The third column signifies the output under high noise conditions (denoted as TROH for SYNDTR and TEOH for SYNDTE). This dataset contains real-world data related to fish measurements. Specifically, the input x is 2-dimensional, where x signifies fish width and x signifies fish length. The output y is the fish weight. The dataset is divided into two files: FISHDTR.csv, which contains the training data, and FISHDTE.csv, which contains the testing data. Each file consists of three columns: "width," "length," and "weight." "Width" and "length" serve as the input features (denoted as TRI for FISHDTR and TEI for FISHDTE), while "weight" is the output (denoted as TRO for FISHDTR and TEO for FISHDTE). III. Problems Problem 1 (20%) This problem focuses on Dataset A, initially considering the low-noise (LN) scenario. Assume that you are aware that m is an M-order polynomial, denoted p, for some M. However, the exact order is unknown. Your objective is to train such that f(x) = PM(x, ) approximates the true f(x), utilizing the available training examples for regression. 1. Implement in Python: Create a function "my_model_train" that takes TRI, TROL, and M as input parameters and minimizes train-MSE to return the trained parameters . Your function should employ SVD-based single-shot LS solution. Do not use any prebuilt poly-fit functions. Implement in Python: Create a function "my_model_test" that accepts , TEI, and TEOL as inputs and calculates and returns test-MSE. 2. Implement in Python: Conduct an experiment using the aforementioned functions to compute train-MSE and test-MSE for the optimized with M = 0,1,...,10. In Fig. 1 of your report plot train-MSE (red curve) and test-MSE (blue curve) vs. M = 0,1,..., 10. Discuss how train-MSE and test- MSE vary across M in Fig. 1. 3. Implement in Python: Repeat steps 2-6 for the high-noise (HN) scenario, using the data sets TRI, TEI, TROH, and TEOH. In Fig. 2 of your report, plot train-MSE (red curve) and test-MSE (blue curve) against M. Discuss how train-MSE and test-MSE vary across M in Fig. 2 and compare these observations with those in Fig. 1. 4. Implement in Python: Repeat steps 2-8, this time limiting the training set to the first 180 data points. Create corresponding Figs. 3 and 4 and discuss the results, comparing Figs. 2 and 3 with Figs. 1 and 2. Problem 2 (20%) - Feature/Input/Output Correlations This problem is based on Dataset B. 1. Implement in Python: Utilize TRI and TRO to compute matrix C. For each (i,j) {1,2}, C(i,j) should contain the absolute value of the correlation coefficient between input features i and j. Additionally, C(i, 3) = C(3,i) should contain the absolute value of the correlation coefficient between 3 input feature i and the output. Present matrix C. Discuss the observed correlations and identify which input feature appears to be most strongly correlated with the output. 2. Implement in Python: In Fig. 5 of your report, scatter-plot weight vs width for the training data. Then, in Fig. 6 of your report, scatter- plot weight vs length for the training data. Discuss your observations based on Figs. 5 and 6. FISHDTE.csv - Notepad File Edit Format View Help width, length, weight 3.8352,22.0,169.0 1.2558,12.1,12.2 6.018,30.5,514.0 4.3056, 24.0, 290.0 3.1234,16.8,78.0 2.673,16.3,90.0 3.977,36.0,345.0 2.9415,15.7,70.0 1.408,7.5,5.9 3.555,19.0,110.0 5.1373,25.2,300.0 3.723,22.0,225.0 6.7473,37.4,975.0 5.1338,30.9,610.0 7.1064,36.9,850.0 3.525,20.0,120.0 2.9181,17.5,120.0 3.6636,21.2,200.0 4.02,23.2,242.0 3.825, 22.0,145.0 6.5736,33.7,800.0 3.3957,19.1,110.0 5.5695,31.3,575.0 7.48,59.0,1650.0 7.4624,37.0,1015.0 5.8515,32.7,714.0 4.69,27.6.390.0 FISHDTR.csv- Notepad File Edit Format View Help width, length, weight 2.268,12.9,40.0 4.1272, 22.1,200.0 4.335,25.4,265.0 1.38,10.4,9.7 5.376,44.8,770.0 3.2943,19.4,120.0 2.9044,17.5,78.0 6.8684,39.0,1100.0 2.6316,15.0,51.5 5.2785,26.8,500.0 3.3756,30.0,200.0 3.3516,19.0,0.0 3.624,20.5,150.0 4.896,42.0,500.0 3.6835,23.0,180.0 6.7408,34.0,700.0 2.0672,13.2,19.7 3.525,20.0,130.0 1.16,10.0,7.5 5.7276,31.0,650.0 7.7957,32.5,840.0 5.1042,28.4,475.0 5.3704, 31.4,685.0 6.3705,38.0,950.0 4.7736,25.0,272.0 6.1306,31.8,680.0 3.534.19.3.130.0 SYNDTR.csv - Notepad File Edit Format View Help TRI, TROL, TROH -2.0,0.7797801013578294, 3.110129736916998 -1.979899497487437,0.7334900940715499,3.522017571464012 -1.9597989949748744,0.6873845575640217,-9.401158212267045 -1.9396984924623115,0.6643223335102355, -3.7010739324007367 -1.9195979899497488,0.6045791321175524,-0.9158959772170008 -1.899497487437186,0.5863989332557281,3.837844681297914 -1.879396984924623,0.539376609695645,5.477940776987349 -1.8592964824120604, 0.47669480059185687,-2.588725395476113 -1.8391959798994975,0.46761814899616266,1.9280784320432742 -1.8190954773869348,0.4344378076039004, -1.4545775317712915 -1.7989949748743719,0.38993604832884404,7.429099183859774 -1.778894472361809,0.36941409556698585,1.5680393250941669 -1.7587939698492463,0.3247242149039432,1.7626066596825398 -1.7386934673366834,0.30337611332530134,1.9002791800822811 -1.7185929648241207,0.27695382931911905,9.63758375231981 -1.6984924623115578, 0.2417380470333166,5.159201515070963 -1.678391959798995,0.21266488428847954,2.971023707626178 -1.6582914572864322,0.18984121550654917,1.529028142347971 -1.6381909547738693,0.19995888997041456,7.4287738552470275 -1.6180904522613067,0.14080836239678757,3.674814998965255 -1.5979899497487438,0.1448777350804104, -4.205201611525807 -1.5778894472361809,0.09931189882651313,2.718938409054841 -1.557788944723618, 0.0849791192817739, -3.7120414889977074 -1.5376884422110553,0.07223210822406867,0.8380130468712469 -1.5175879396984926,0.05270961076492344,0.4786649558186202 -1.4974874371859297,0.018114822915554447,-1.4007347663089225 -1.4773869346733668,0.008053188708364923.9.606248271593234 SYNDTE.csv - Notepad File Edit Format View Help TEI, TEOL, TEOH -2.0,0.7673065575965415,0.1235565095361627 -1.9977765425236242,0.7943153591932017,1.7326977723474648 -1.9955530850472485,0.7555639265809324,1.6731494031235508 -1.9933296275708727,0.7614462415560284,1.0054139405737343 -1.991106170094497,0.7606488308433215,4.039788952036721 -1.9888827126181212,0.761312626856185, -0.29215073589232987 -1.9866592551417455,0.7489044855478995, -2.182250446781628 -1.9844357976653697,0.7570355170544998,1.7942388306922106 -1.982212340188994,0.7416562199777219,2.8470072452199324 -1.9799888827126182,0.7582756085459741, 4.074939868993058 -1.9777654252362424,0.7395068145658071,2.424837575239192 -1.9755419677598667,0.7366429368356119,10.821674885305438 -1.973318510283491,0.7241662664281812,4.508093019131171 -1.9710950528071152,0.7231835861240143,2.0058279489547886 -1.9688715953307394,0.7120192568545678,3.51913158306964 -1.9666481378543634,0.719804542660765, -7.482037309227453 -1.9644246803779877,0.7044766896317838, -9.241684444324129 -1.962201222901612,0.6948753549479644,0.3376946557104504 -1.9599777654252362,0.6957621694749753,0.10309533071685884 -1.9577543079488604,0.6861108321395015, 5.149506650813418 -1.9555308504724846,0.6813029142267479,0.028858605978796303 -1.953307392996109,0.6893520984180296,3.1650418604655735 -1.9510839355197331,0.6855969508171061,2.1792827212201322 -1.9488604780433574,0.6774649848763484,2.0721530158573676 -1.9466370205669816,0.662126569361612,3.810070166479305 -1.9444135630906059, 0.6511433187121868,2.1129793296285344 -1.9421901056142301,0.6570036100967817.1.2526295448362181
Step by Step Solution
There are 3 Steps involved in it
Solutions Step 1 Problem 1 Step 1 Implement the mymodeltrain function in Python This function should take TRI TROL and M as input parameters and retur... View full answer

Get step-by-step solutions from verified subject matter experts


