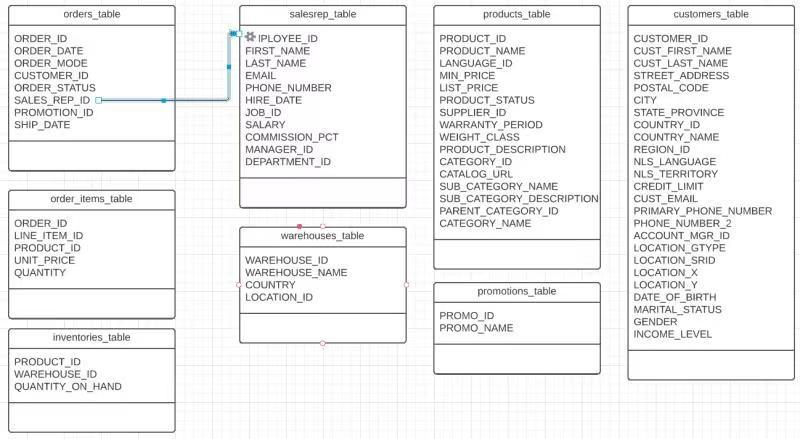
Question: Dataset (`handy-bonbon-142723.order_entry_dataset`) available on Google BigQuery. 1) Write a SQL statement to show the total dollar amount sold to customers summarized by state/province of their
Dataset (`handy-bonbon-142723.order_entry_dataset`) available on Google BigQuery.
1) Write a SQL statement to show the total dollar amount sold to customers summarized by state/province of their shipping address and each month of each Year (YYYY-MM). Only include orders that shipped within 5 days of ordering.
2) Write a SQL statement to show the total dollar amount sold summarized by product name and Year along with RANK. The largest sales by product by year should be ranked #1.
3) Write a SQL statement to show all US-based customers names, state/province and total dollar amount sold on all orderable products in the hardware product category. Calculate the percentage contribution of each customers sales to the total sales.
4) Write a SQL statement to show the product that has the largest percentage markup (List price above Min Price). Only consider products that are available in the US or India warehouses.
5) Which month (be sure to say from which year) had the largest percentage increase in sales over the prior month? Justify your rationale and show your SQL query (Hint: use the LAG function).
6) Who is the best customer? Justify your rationale and back it up with queries and data. You may also wish to graph various data to support your justification. DO NOT just total up sales. Look at other tables and analysis as well (CLV and RFM models for example).
7) Create a VIEW in your own schema that joins together all of the columns in these tables: PRODUCTS, CUSTOMERS, ORDERS, ORDER_ITEMS, PROMOTIONS and SALESREP. Be aware that not all orders have sales reps. Export this view to a CSV file. Click Save Results button and then select CSV File (Google Drive). Download the CSV file from Google Drive.
8) Import all of the data from your VIEW into Microsoft Excel. Create a pivot table from the resulting data set and then summarize the data according to total sales by product category and customer state/province.
9) Import all of the data from your VIEW into Tableau or Google Data Studio. Create an appropriate visualization from the resulting data set that summarizes the data according to total sales by product category and customer country State/Province over time.
The table names are: products_table, customers_table, orders_table, order_items_table, promotions_table, salesrep_table, warehouses_table, and inventories_table

orders_table products_table customers_table ORDER ID ORDER DATE ORDER_MODE CUSTOMER_ID ORDER STATUS SALES_REP_ID C- PROMOTION_ID SHIP DATE salesrep_table IPLOYEE_ID FIRST NAME LAST_NAME EMAIL PHONE NUMBER HIRE_DATE JOB_ID SALARY COMMISSION_PCT MANAGER ID DEPARTMENT_ID PRODUCT_ID PRODUCT_NAME LANGUAGE_ID MIN_PRICE LIST PRICE PRODUCT_STATUS SUPPLIER_ID WARRANTY PERIOD WEIGHT_CLASS PRODUCT DESCRIPTION CATEGORY_ID CATALOG URL SUB_CATEGORY_NAME SUB_CATEGORY DESCRIPTION PARENT_CATEGORY_ID CATEGORY_NAME CUSTOMER_ID CUST_FIRST_NAME CUST_LAST_NAME STREET_ADDRESS POSTAL_CODE CITY STATE_PROVINCE COUNTRY_ID COUNTRY NAME REGION_ID NLS_LANGUAGE NLS TERRITORY CREDIT_LIMIT CUST_EMAIL PRIMARY_PHONE_NUMBER PHONE_NUMBER_2 ACCOUNT_MGR_ID LOCATION_GTYPE LOCATION_SRID LOCATION_X LOCATION Y DATE_OF_BIRTH MARITAL_STATUS GENDER INCOME LEVEL order_items_table warehouses_table ORDER_ID LINE_ITEM_ID PRODUCT ID UNIT_PRICE QUANTITY WAREHOUSE_ID WAREHOUSE_NAME COUNTRY LOCATION_ID promotions_table PROMO ID PROMO NAME inventories_table PRODUCT_ID WAREHOUSE_ID QUANTITY_ON_HAND orders_table products_table customers_table ORDER ID ORDER DATE ORDER_MODE CUSTOMER_ID ORDER STATUS SALES_REP_ID C- PROMOTION_ID SHIP DATE salesrep_table IPLOYEE_ID FIRST NAME LAST_NAME EMAIL PHONE NUMBER HIRE_DATE JOB_ID SALARY COMMISSION_PCT MANAGER ID DEPARTMENT_ID PRODUCT_ID PRODUCT_NAME LANGUAGE_ID MIN_PRICE LIST PRICE PRODUCT_STATUS SUPPLIER_ID WARRANTY PERIOD WEIGHT_CLASS PRODUCT DESCRIPTION CATEGORY_ID CATALOG URL SUB_CATEGORY_NAME SUB_CATEGORY DESCRIPTION PARENT_CATEGORY_ID CATEGORY_NAME CUSTOMER_ID CUST_FIRST_NAME CUST_LAST_NAME STREET_ADDRESS POSTAL_CODE CITY STATE_PROVINCE COUNTRY_ID COUNTRY NAME REGION_ID NLS_LANGUAGE NLS TERRITORY CREDIT_LIMIT CUST_EMAIL PRIMARY_PHONE_NUMBER PHONE_NUMBER_2 ACCOUNT_MGR_ID LOCATION_GTYPE LOCATION_SRID LOCATION_X LOCATION Y DATE_OF_BIRTH MARITAL_STATUS GENDER INCOME LEVEL order_items_table warehouses_table ORDER_ID LINE_ITEM_ID PRODUCT ID UNIT_PRICE QUANTITY WAREHOUSE_ID WAREHOUSE_NAME COUNTRY LOCATION_ID promotions_table PROMO ID PROMO NAME inventories_table PRODUCT_ID WAREHOUSE_ID QUANTITY_ON_HAND
Step by Step Solution
There are 3 Steps involved in it

Get step-by-step solutions from verified subject matter experts


