

Answered step by step
Verified Expert Solution
Question
1 Approved Answer
Dataset: https://drive.google.com/file/d/1Ru-0QOyz8Z_X2_zFBBWLWy637hf36l47/view?usp=sharing NOTE: please input the code Predict the price of Brent oil Using Linear Regression By observing the markets you learn everything about people,
Dataset: https://drive.google.com/file/d/1Ru-0QOyz8Z_X2_zFBBWLWy637hf36l47/view?usp=sharing
NOTE: please input the code
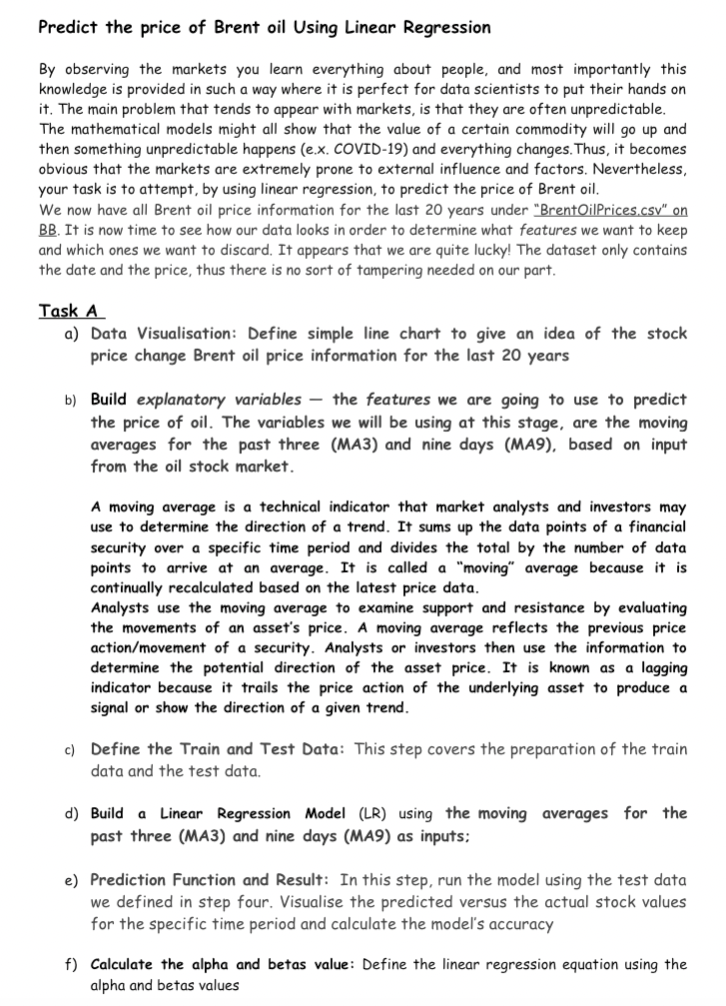
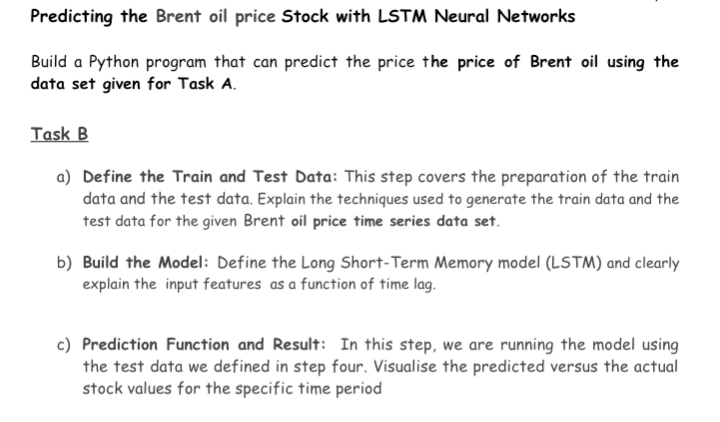
Predict the price of Brent oil Using Linear Regression By observing the markets you learn everything about people, and most importantly this knowledge is provided in such a way where it is perfect for data scientists to put their hands on it. The main problem that tends to appear with markets, is that they are often unpredictable. The mathematical models might all show that the value of a certain commodity will go up and then something unpredictable happens (e.x. COVID-19) and everything changes. Thus, it becomes obvious that the markets are extremely prone to external influence and factors. Nevertheless, your task is to attempt, by using linear regression, to predict the price of Brent oil. We now have all Brent oil price information for the last 20 years under "BrentOilPrices.csv" on BB. It is now time to see how our data looks in order to determine what features we want to keep and which ones we want to discard. It appears that we are quite lucky! The dataset only contains the date and the price, thus there is no sort of tampering needed on our part. Task A a) Data Visualisation: Define simple line chart to give an idea of the stock price change Brent oil price information for the last 20 years b) Build explanatory variables - the features we are going to use to predict the price of oil. The variables we will be using at this stage, are the moving averages for the past three (MA3) and nine days (MA9), based on input from the oil stock market. A moving average is a technical indicator that market analysts and investors may use to determine the direction of a trend. It sums up the data points of a financial security over a specific time period and divides the total by the number of data points to arrive at an average. It is called a "moving" average because it is continually recalculated based on the latest price data. Analysts use the moving average to examine support and resistance by evaluating the movements of an asset's price. A moving average reflects the previous price action/movement of a security. Analysts or investors then use the information to determine the potential direction of the asset price. It is known as a lagging indicator because it trails the price action of the underlying asset to produce a signal or show the direction of a given trend. c) Define the Train and Test Data: This step covers the preparation of the train data and the test data. d) Build a Linear Regression Model (LR) using the moving averages for the past three (MA3) and nine days (MA9) as inputs: e) Prediction Function and Result: In this step, run the model using the test data we defined in step four. Visualise the predicted versus the actual stock values for the specific time period and calculate the model's accuracy f) Calculate the alpha and betas value: Define the linear regression equation using the alpha and betas values Predicting the Brent oil price Stock with LSTM Neural Networks Build a Python program that can predict the price the price of Brent oil using the data set given for Task A. Task B a) Define the Train and Test Data: This step covers the preparation of the train data and the test data. Explain the techniques used to generate the train data and the test data for the given Brent oil price time series data set. b) Build the Model: Define the Long Short-Term Memory model (LSTM) and clearly explain the input features as a function of time lag. c) Prediction Function and Result: In this step, we are running the model using the test data we defined in step four. Visualise the predicted versus the actual stock values for the specific time periodStep by Step Solution
There are 3 Steps involved in it
Step: 1

Get Instant Access to Expert-Tailored Solutions
See step-by-step solutions with expert insights and AI powered tools for academic success
Step: 2

Step: 3
Ace Your Homework with AI
Get the answers you need in no time with our AI-driven, step-by-step assistance
Get Started
Database And Expert Systems Applications 15th International Conference Dexa 2004 Zaragoza Spain August 30 September 3 2004 Proceedings Lncs 3180
Authors: Fernando Galindo ,Makoto Takizawa ,Roland Traunmuller
2004th Edition