

Question
(Dataset: States. Variables: vep16_turnout, clinton16.) An article of faith among Democratic Party strategists (and a source of apprehension among Republican strategists) is that high voter
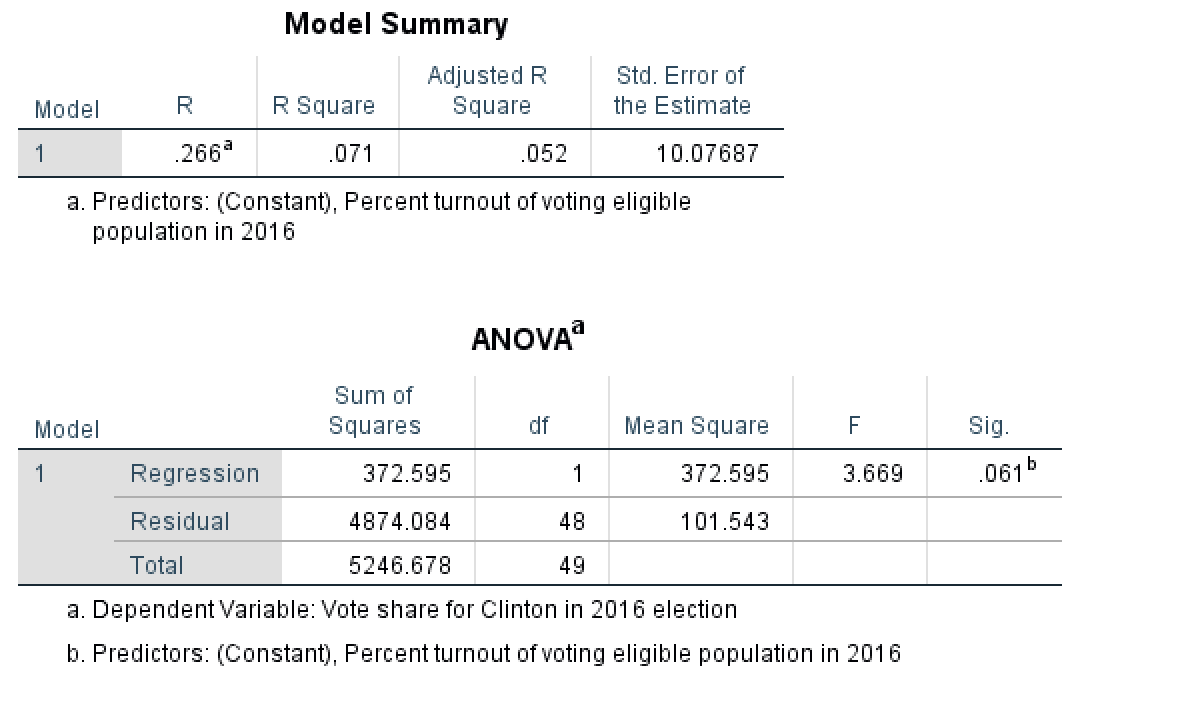
- (Dataset: States. Variables: vep16_turnout, clinton16.) An article of faith among Democratic Party strategists (and a source of apprehension among Republican strategists) is that high voter turnouts help Democratic candidates. Why should this be the case? According to the conventional wisdom, Democratic electorates are less likely to vote than are Republican voters. Thus, low turnouts naturally favor Republican candidates. As turnouts push higher, the reasoning goes, a larger number of potential Democratic voters will go to the polls, creating a better opportunity for Democratic candidates. Therefore, as turnouts go up, so should the Democratic percentage of the vote.14Use theAnalyze ?Regression ?Linear procedure to test this conventional wisdom. The States dataset contains vep16_turnout, the percentage of the state voting-eligible population that turned out to vote in the 2016 presidential election. This is the independent variable. Another variable, clinton16, the percentage of the vote cast for Democratic candidate Hillary Clinton, is the dependent variable.
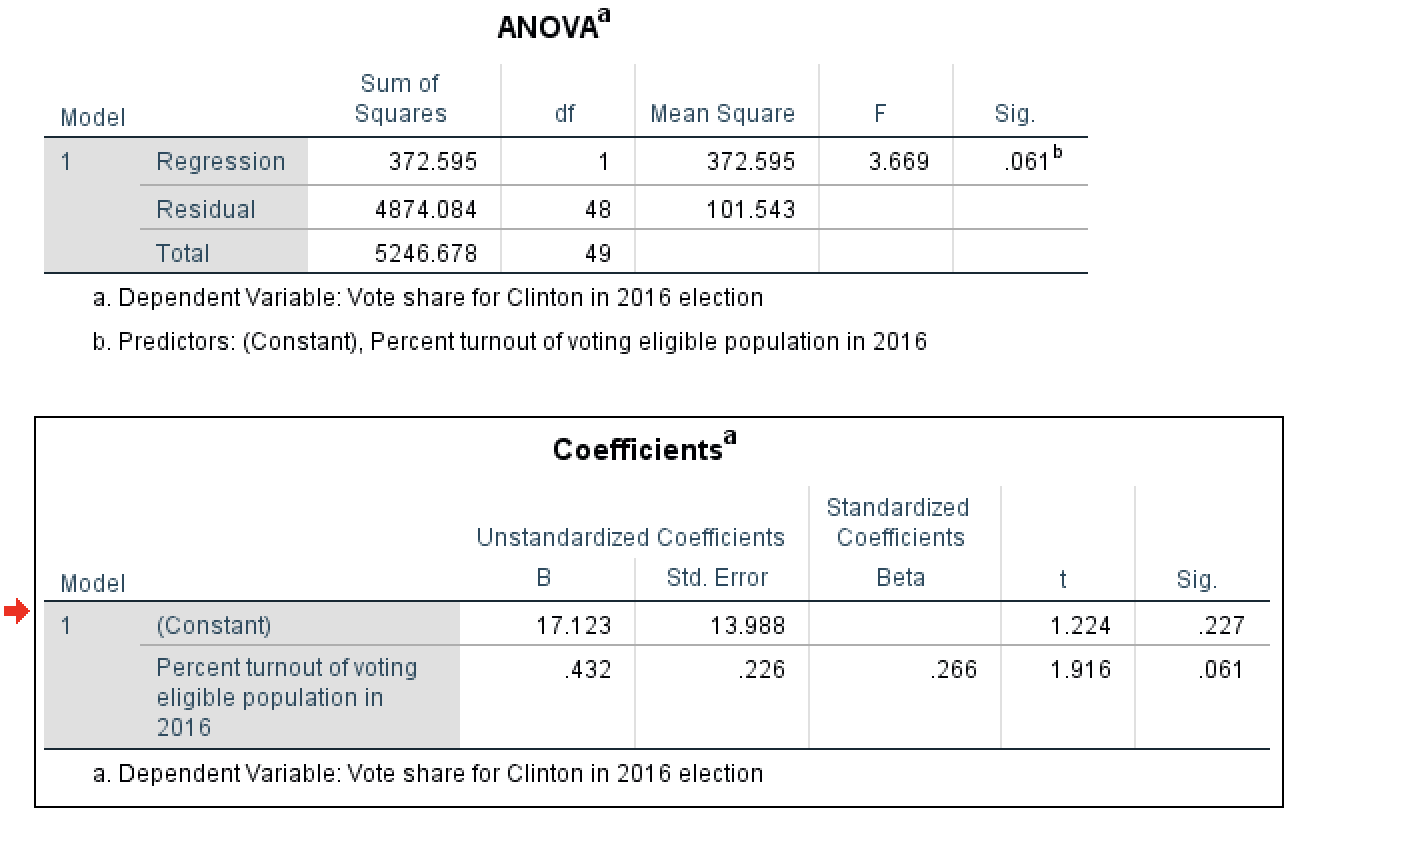
A) Use linear regression analysis to examine the relationship between voter turnout and Hillary Clinton's vote share. Complete the following table.
Coefficient
Standard Error
t-ratio
P-value
% Voter turnout
?
?
?
?
Constant term
?
?
1.22
0.227
N
?
R-squared
?
Adjusted R-squared
?
B) Based on your results, the regression equation for estimating the percentage voting for Hillary Clinton is (fill in the blanks, put the constant, _cons, in the last blank)
Clinton Voter Percentage = _____________ Percentage Turnout + ____________.
C) Consider your findings in parts A and B. One may conclude that (complete one option)
??The conventional wisdom is correct because
??The conventional wisdom is incorrect because
DataSet
Step by Step Solution
There are 3 Steps involved in it
Step: 1

Get Instant Access to Expert-Tailored Solutions
See step-by-step solutions with expert insights and AI powered tools for academic success
Step: 2

Step: 3
Ace Your Homework with AI
Get the answers you need in no time with our AI-driven, step-by-step assistance
Get Started
Algebra And Trigonometry, Enhanced
Authors: Cynthia Y Young
4th Edition
1119320860, 9781119320869