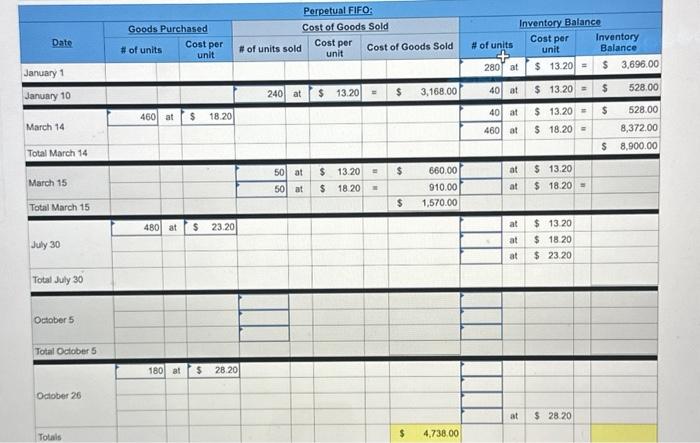
Date January 1 January 10 March 14 Total March 14 March 15 Total March 15 July 30 Total July 30 October 5 Total October 5 October 26 Totals Goods Purchased # of units Cost per unit 460 at $ 18.20 480 at $ 23.20 180 at $ 28.20 # of units sold 240 Perpetual FIFO: Cost of Goods Sold at Cost per unit $ 50 50 at $ $ at 13.20 LA 13.20 18.20 Cost of Goods Sold E = $ $ $ CA 3,168.00 660.00 910.00 1,570.00 $ 4,738.00 # of units 280 at 40 at 40 at 460 at at at at at at at Inventory Balance Cost per unit $13.20 $ $ $ 13.20 = $ $18.20 $13.20 $ 13.20 $18.20 $23.20 = $ 13.20 $ 18.20 = $ 28.20 11 Inventory Balance 3,696.00 528.00 528.00 8,372.00 $ 8,900.00
\begin{tabular}{|c|c|c|c|c|c|c|c|c|c|c|c|c|c|c|c|c|c|c|} \hline \multicolumn{19}{|c|}{ Perpetual FIFO: } \\ \hline \multirow{3}{*}{\begin{tabular}{l} Date \\ January 1 \end{tabular}} & \multicolumn{4}{|c|}{ Goods Purchased } & \multicolumn{7}{|c|}{ Cost of Goods Sold } & \multicolumn{7}{|c|}{ Inventory Balance } \\ \hline & \multicolumn{2}{|l|}{ \# of units } & \multicolumn{2}{|c|}{\begin{tabular}{c} Cost per \\ unit \end{tabular}} & \multicolumn{2}{|c|}{ II of units sold } & \multicolumn{2}{|c|}{\begin{tabular}{c} Cost per \\ unit \end{tabular}} & \multicolumn{3}{|c|}{ Cost of Goods Sold } & \multicolumn{2}{|c|}{ \# of units } & \multicolumn{2}{|c|}{\begin{tabular}{c} Cost per \\ unit \end{tabular}} & \multicolumn{3}{|c|}{\begin{tabular}{l} Inventory \\ Balance \end{tabular}} \\ \hline & & & & & & & & & & & & 280 & at & $ & 13.20 & = & $ & 3,696.00 \\ \hline January 10 & & & & & 240 & at & $ & 13.20 & = & $ & 3,168.00 & 40 & at & $ & 13.20 & = & $ & 528.00 \\ \hline \multirow{2}{*}{ March 14} & 460 & at & $ & 18.20 & & & & & & & & 40 & at & $ & 13.20 & = & $ & 528.00 \\ \hline & & & & & & & & & & & & 460 & at & 3 & 18.20 & = & & 8,372.00 \\ \hline Total March 14 & & & & & & & & & & & & & & & & & $ & 8,900.00 \\ \hline \multirow[b]{2}{*}{ March 15} & & & & & 50 & at & $ & 13.20 & = & $ & 660.00 & & at & $ & 13.20 & & & \\ \hline & & & & & 50 & at & $ & 18.20 & = & & 910.002 & & at & $ & 18.20 & = & & \\ \hline Total March 15 & & & & & & & & & & & 1,570.00 & & & & & & & \\ \hline \multirow{3}{*}{ July 30} & 480 & at & $ & 23.20 & & & & & & & & & at & $ & 13.20 & & & \\ \hline & & & & & & & & & & & & + & at & $ & 18.20 & & & \\ \hline & & & & & & & & & & & & & at & $ & 23.20 & & & \\ \hline \multicolumn{19}{|l|}{ Total July 30} \\ \hline & & & & & & & & & & & & & & & & & & \\ \hline \multicolumn{19}{|l|}{ Octaber 5} \\ \hline & & & & & & & & & & & & & & & & & & \\ \hline \multicolumn{19}{|l|}{ Total October 5} \\ \hline \multirow{4}{*}{ October 26} & 180 & at & 5 & 28.20 & & & & & & & & & & & & & & \\ \hline & & & & & & & & & & & & & & & & & & \\ \hline & & & & & & & & & & & & & & & & & & \\ \hline & & & & & & & & & & & & & at & $ & 28.20 & & & \\ \hline Totals & & & & & & & & & & s & 4,738.00 & & & & & & & \\ \hline \end{tabular} \begin{tabular}{|c|c|c|c|c|c|c|c|c|c|c|c|c|c|c|c|c|c|c|} \hline \multicolumn{19}{|c|}{ Perpetual FIFO: } \\ \hline \multirow{3}{*}{\begin{tabular}{l} Date \\ January 1 \end{tabular}} & \multicolumn{4}{|c|}{ Goods Purchased } & \multicolumn{7}{|c|}{ Cost of Goods Sold } & \multicolumn{7}{|c|}{ Inventory Balance } \\ \hline & \multicolumn{2}{|l|}{ \# of units } & \multicolumn{2}{|c|}{\begin{tabular}{c} Cost per \\ unit \end{tabular}} & \multicolumn{2}{|c|}{ II of units sold } & \multicolumn{2}{|c|}{\begin{tabular}{c} Cost per \\ unit \end{tabular}} & \multicolumn{3}{|c|}{ Cost of Goods Sold } & \multicolumn{2}{|c|}{ \# of units } & \multicolumn{2}{|c|}{\begin{tabular}{c} Cost per \\ unit \end{tabular}} & \multicolumn{3}{|c|}{\begin{tabular}{l} Inventory \\ Balance \end{tabular}} \\ \hline & & & & & & & & & & & & 280 & at & $ & 13.20 & = & $ & 3,696.00 \\ \hline January 10 & & & & & 240 & at & $ & 13.20 & = & $ & 3,168.00 & 40 & at & $ & 13.20 & = & $ & 528.00 \\ \hline \multirow{2}{*}{ March 14} & 460 & at & $ & 18.20 & & & & & & & & 40 & at & $ & 13.20 & = & $ & 528.00 \\ \hline & & & & & & & & & & & & 460 & at & 3 & 18.20 & = & & 8,372.00 \\ \hline Total March 14 & & & & & & & & & & & & & & & & & $ & 8,900.00 \\ \hline \multirow[b]{2}{*}{ March 15} & & & & & 50 & at & $ & 13.20 & = & $ & 660.00 & & at & $ & 13.20 & & & \\ \hline & & & & & 50 & at & $ & 18.20 & = & & 910.002 & & at & $ & 18.20 & = & & \\ \hline Total March 15 & & & & & & & & & & & 1,570.00 & & & & & & & \\ \hline \multirow{3}{*}{ July 30} & 480 & at & $ & 23.20 & & & & & & & & & at & $ & 13.20 & & & \\ \hline & & & & & & & & & & & & + & at & $ & 18.20 & & & \\ \hline & & & & & & & & & & & & & at & $ & 23.20 & & & \\ \hline \multicolumn{19}{|l|}{ Total July 30} \\ \hline & & & & & & & & & & & & & & & & & & \\ \hline \multicolumn{19}{|l|}{ Octaber 5} \\ \hline & & & & & & & & & & & & & & & & & & \\ \hline \multicolumn{19}{|l|}{ Total October 5} \\ \hline \multirow{4}{*}{ October 26} & 180 & at & 5 & 28.20 & & & & & & & & & & & & & & \\ \hline & & & & & & & & & & & & & & & & & & \\ \hline & & & & & & & & & & & & & & & & & & \\ \hline & & & & & & & & & & & & & at & $ & 28.20 & & & \\ \hline Totals & & & & & & & & & & s & 4,738.00 & & & & & & & \\ \hline \end{tabular}