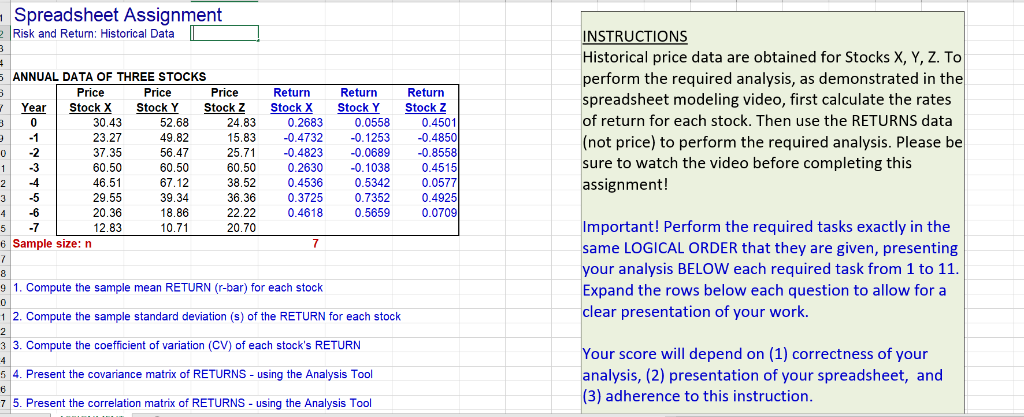
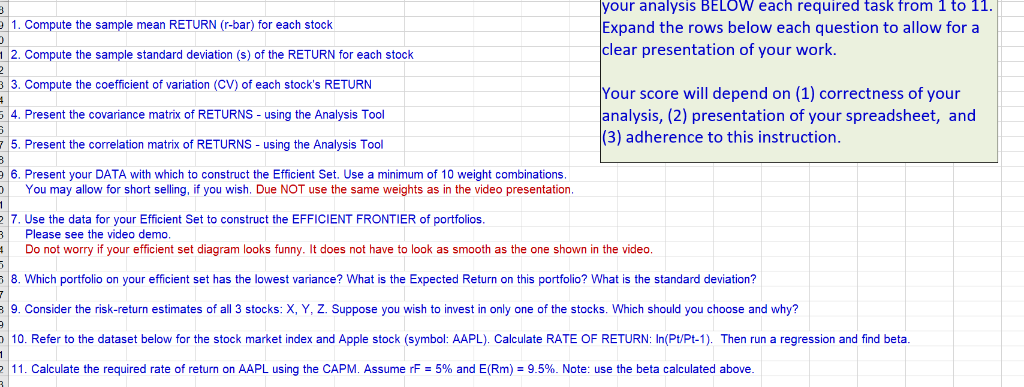
Question
Date SP500 AAPL 1 2011/2/1 1,307.59 345.03 2 2011/1/3 1,286.12 339.32 3 2010/12/1 1,257.64 322.56 4 2010/11/1 1,180.55 311.15 5 2010/10/1 1,183.26 300.98 6 2010/9/1

 Date SP500 AAPL 1 2011/2/1 1,307.59 345.03 2 2011/1/3 1,286.12 339.32 3 2010/12/1 1,257.64 322.56 4 2010/11/1 1,180.55 311.15 5 2010/10/1 1,183.26 300.98 6 2010/9/1 1,141.20 283.75 7 2010/8/2 1,049.33 243.10 8 2010/7/1 1,101.60 257.25 9 2010/6/1 1,030.71 251.53 10 2010/5/3 1,089.41 256.88 11 2010/4/5 1,186.69 261.09 12 2010/3/1 1,169.43 235.00 13 2010/2/1 1,104.49 204.62 14 2010/1/4 1,073.87 192.06 15 2009/12/1 1,115.10 210.73 16 2009/11/2 1,095.63 199.91 17 2009/10/1 1,036.19 188.50 18 2009/9/1 1,057.08 185.35 19 2009/8/3 1,020.62 168.21 20 2009/7/1 987.48 163.39 21 2009/6/1 919.32 142.43 22 2009/5/4 919.14 135.81 23 2009/4/1 872.81 125.83 24 2009/3/2 797.87 105.12 25 2009/2/2 735.09 89.31 26 2009/1/2 825.88 90.13 27 2008/12/1 903.25 85.35 28 2008/11/3 896.24 92.67 29 2008/10/1 968.75 107.59 30 2008/9/1 1,166.36 113.66 31 2008/8/1 1,282.83 169.53 32 2008/7/1 1,267.38 158.95 33 2008/6/2 1,280.00 167.44 34 2008/5/2 1,400.38 188.75 35 2008/4/1 1,385.59 173.95 36 2008/3/3 1,322.70 143.50 37 2008/2/1 1,330.63 125.02 38 2008/1/2 1,378.55 135.36 39 2007/12/3 1,468.36 198.08 40 2007/11/1 1,481.14 182.22 41 2007/10/1 1,549.38 189.95 42 2007/9/3 1,526.75 153.47 43 2007/8/1 1,473.99 138.48 44 2007/7/2 1,455.27 131.76 45 2007/6/1 1,503.35 122.04 46 2007/5/2 1,530.62 121.19 47 2007/4/3 1,482.37 99.80 48 2007/3/1 1,420.86 92.91 49 2007/2/1 1,406.82 84.61 50 2007/1/2 1,438.24 85.73 51 2006/12/1 1,418.30 84.84 52 2006/11/1 1,400.63 91.66 53 2006/10/2 1,377.94 81.08 54 2006/9/1 1,335.85 76.98 55 2006/8/1 1,303.82 67.85 56 2006/7/3 1,276.66 67.96 57 2006/6/1 1,270.20 57.27 58 2006/5/2 1,270.09 59.77 59 2006/4/3 1,310.61 70.39 60 2006/3/1 1,294.87 62.72 61 2006/2/1 1,280.66 68.49 62 2006/1/2 1,280.08 75.51 63 2005/12/1 1,248.29 71.89 64 2005/11/1 1,249.48 67.82 65 2005/10/3 1,207.01 57.59 66 2005/9/1 1,228.81 53.61 67 2005/8/1 1,220.33 46.89 68 2005/7/1 1,234.18 42.65 69 2005/6/1 1,191.33 36.81 70 2005/5/2 1,191.50 39.76 71 2005/4/1 1,156.85 36.06 72 2005/3/1 1,180.59 41.67 73 2005/2/1 1,203.60 44.86 74 2005/1/3 1,181.27 38.45 75 2004/12/1 1,211.92 32.20 76 2004/11/1 1,173.82 33.53 77 2004/10/1 1,130.20 26.20 78 2004/9/1 1,114.58 19.38 79 2004/8/2 1,104.24 17.25 80 2004/7/1 1,101.72 16.17 81 2004/6/1 1,140.84 16.27 82 2004/5/3 1,120.68 14.03 83 2004/4/1 1,107.30 12.89 84 2004/3/1 1,126.21 13.52 85 2004/2/2 1,144.94 11.96 86 2004/1/2 1,131.13 11.28 87 2003/12/1 1,111.92 10.69 88 2003/11/3 1,058.20 10.45 89 2003/10/1 1,050.71 11.44 90 2003/9/1 995.97 10.36 91 2003/8/1 1,008.01 11.31 92 2003/7/1 990.31 10.54 93 2003/6/2 974.50 9.53 94 2003/5/2 963.59 8.98 95 2003/4/1 916.92 7.11 96 2003/3/3 848.18 7.07 97 2003/2/3 841.15 7.51 98 2003/1/2 855.70 7.18 99 2002/12/2 879.82 7.16 100 2002/11/1 936.31 7.75 101 2002/10/1 885.76 8.03 102 2002/9/2 815.28 7.25 103 2002/8/1 916.07 7.38 104 2002/7/1 911.62 7.63 105 2002/6/3 989.82 8.86 106 2002/5/2 1,067.14 11.65 107 2002/4/2 1,076.92 12.14 108 2002/3/1 1,147.39 11.84 109 2002/2/1 1,106.73 10.85 110 2002/1/2 1,130.20 12.36 111 2001/12/3 1,148.08 10.95 112 2001/11/1 1,139.45 10.65 113 2001/10/1 1,059.78 8.78 114 2001/9/3 1,040.94 7.76 115 2001/8/1 1,133.58 9.27 116 2001/7/2 1,211.23 9.40 117 2001/6/1 1,224.38 11.62 118 2001/5/2 1,255.82 9.98 119 2001/4/3 1,249.46 12.74 120 2001/3/1 1,160.33 11.03 121 2001/2/1 1,239.94 9.12 122 2001/1/2 1,366.01 10.81 123 2000/12/1 1,320.28 7.44 124 2000/11/1 1,314.95 8.25 125 2000/10/9 1,429.40 9.78 126 2000/9/1 1,436.51 12.88 127 2000/8/1 1,517.68 30.47 128 2000/7/3 1,430.83 25.41 129 2000/6/1 1,454.60 26.19 130 2000/5/1 1,420.60 21.00 131 2000/4/3 1,452.43 31.01 132 2000/3/1 1,498.58 33.95 133 2000/2/1 1,366.42 28.66 134 2000/1/3 1,394.46 25.94 135 1999/12/1 1,469.25 25.70 136 1999/11/1 1,388.91 24.47 137 1999/10/1 1,362.93 20.03 138 1999/9/1 1,282.71 15.83 139 1999/8/2 1,320.41 16.31 140 1999/7/1 1,328.72 13.92 141 1999/6/1 1,372.71 11.58 142 1999/5/3 1,301.84 11.02 143 1999/4/1 1,335.18 11.50 144 1999/3/1 1,286.37 8.98 145 1999/2/1 1,238.33 8.70 146 1999/1/7 1,279.64 10.30
Step by Step Solution
There are 3 Steps involved in it
Step: 1

Get Instant Access to Expert-Tailored Solutions
See step-by-step solutions with expert insights and AI powered tools for academic success
Step: 2

Step: 3

Ace Your Homework with AI
Get the answers you need in no time with our AI-driven, step-by-step assistance
Get Started


