| | Date | Ticker | Price Alternate | | Date | Ticker | Price Alternate | | Date | Ticker | Price Alternate | | Date | Level of the S&P 500 Index | | Date | 3-Month T-Bill Rate (%) | | |
| | 20010131 | AAPL | 21.625 | | 20010131 | JPM | 54.99 | | 20010131 | AMZN | 17.3125 | | 20010131 | 1366.01 | | 20010131 | 4.88 | | |
| | 20010228 | AAPL | 18.25 | | 20010228 | JPM | 46.66 | | 20010228 | AMZN | 10.1875 | | 20010228 | 1239.94 | | 20010228 | 4.42 | | |
| | 20010330 | AAPL | 22.07 | | 20010330 | JPM | 44.9 | | 20010330 | AMZN | 10.23 | | 20010330 | 1160.33 | | 20010330 | 3.87 | | |
| | 20010430 | AAPL | 25.49 | | 20010430 | JPM | 47.98 | | 20010430 | AMZN | 15.78 | | 20010430 | 1249.46 | | 20010430 | 3.62 | | |
| | 20010531 | AAPL | 19.95 | | 20010531 | JPM | 49.15 | | 20010531 | AMZN | 16.69 | | 20010531 | 1255.82 | | 20010531 | 3.49 | | |
| | 20010629 | AAPL | 23.25 | | 20010629 | JPM | 44.6 | | 20010629 | AMZN | 14.15 | | 20010629 | 1224.42 | | 20010629 | 3.51 | | |
| | 20010731 | AAPL | 18.79 | | 20010731 | JPM | 43.3 | | 20010731 | AMZN | 12.49 | | 20010731 | 1211.23 | | 20010731 | 3.36 | | |
| | 20010831 | AAPL | 18.55 | | 20010831 | JPM | 39.4 | | 20010831 | AMZN | 8.94 | | 20010831 | 1133.58 | | 20010831 | 2.64 | | |


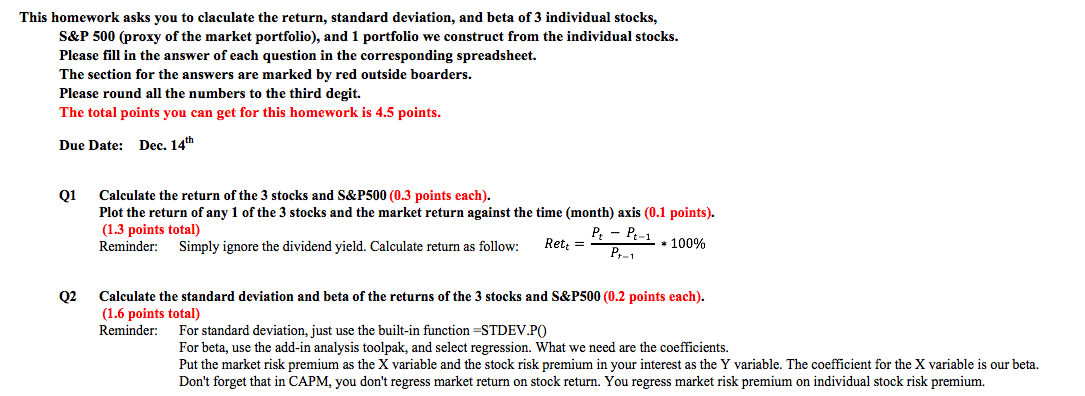
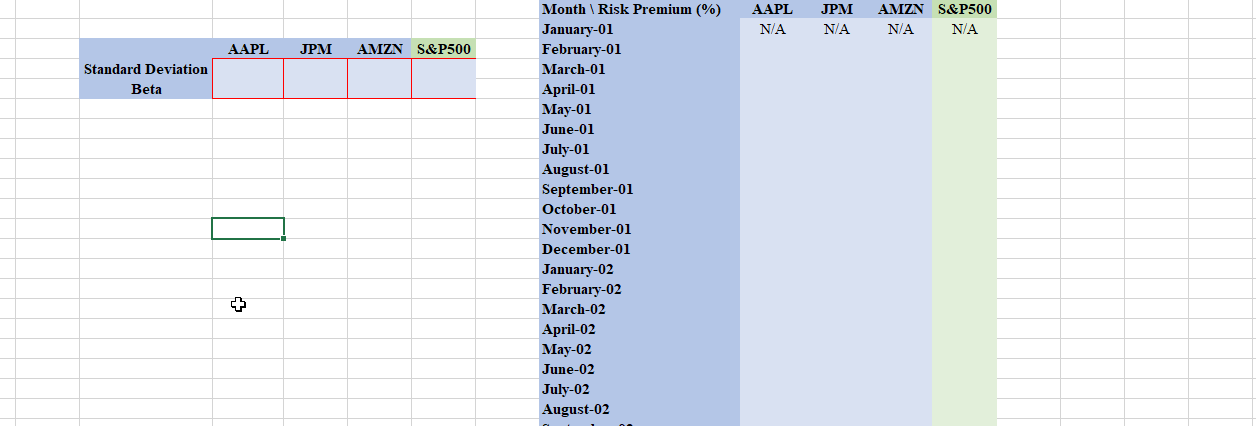
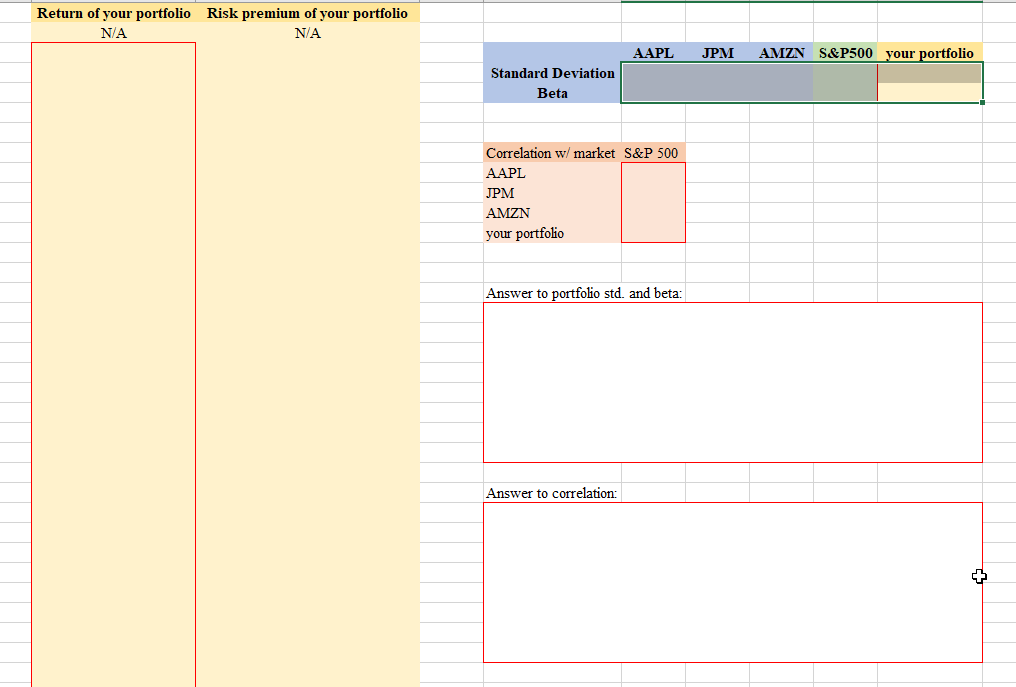
This homework asks you to claculate the return, standard deviation, and beta of 3 individual stocks, S&P 500 (proxy of the market portfolio), and 1 portfolio we construct from the individual stocks. Please fill in the answer of each question in the corresponding spreadsheet. The section for the answers are marked by red outside boarders. Please round all the numbers to the third degit. The total points you can get for this homework is 4.5 points. Due Date: Dec. 14th Q1 Calculate the return of the 3 stocks and S&P500 (0.3 points each). Plot the return of any 1 of the 3 stocks and the market return against the time (month) axis (0.1 points). (1.3 points total) P- Pt-1 Reminder: Simply ignore the dividend yield. Calculate return as follow: Rett = *100% P-1 Q2 Calculate the standard deviation and beta of the returns of the 3 stocks and S&P500 (0.2 points each). (1.6 points total) Reminder: For standard deviation, just use the built-in function=STDEV.PO For beta, use the add-in analysis toolpak, and select regression. What we need are the coefficients. Put the market risk premium as the X variable and the stock risk premium in your interest as the Y variable. The coefficient for the X variable is our beta. Don't forget that in CAPM, you don't regress market return on stock return. You regress market risk premium on individual stock risk premium. AAPL N/A JPM N/A AMZN S&P500 N/A N/A AAPL JPM AMZN S&P500 Standard Deviation Beta O Month Risk Premium (%) January-01 February-01 March-01 April-01 May-01 June-01 July-01 August-01 September-01 October-01 November-01 December-01 January-02 February-02 March-02 April-02 May-02 June-02 July-02 August-02 + Return of your portfolio Risk premium of your portfolio N/A NA AAPL JPM AMZN S&P500 your portfolio Standard Deviation Beta Correlation w/ market S&P 500 AAPL JPM AMZN your portfolio Answer to portfolio std. and beta: Answer to correlation: This homework asks you to claculate the return, standard deviation, and beta of 3 individual stocks, S&P 500 (proxy of the market portfolio), and 1 portfolio we construct from the individual stocks. Please fill in the answer of each question in the corresponding spreadsheet. The section for the answers are marked by red outside boarders. Please round all the numbers to the third degit. The total points you can get for this homework is 4.5 points. Due Date: Dec. 14th Q1 Calculate the return of the 3 stocks and S&P500 (0.3 points each). Plot the return of any 1 of the 3 stocks and the market return against the time (month) axis (0.1 points). (1.3 points total) P- Pt-1 Reminder: Simply ignore the dividend yield. Calculate return as follow: Rett = *100% P-1 Q2 Calculate the standard deviation and beta of the returns of the 3 stocks and S&P500 (0.2 points each). (1.6 points total) Reminder: For standard deviation, just use the built-in function=STDEV.PO For beta, use the add-in analysis toolpak, and select regression. What we need are the coefficients. Put the market risk premium as the X variable and the stock risk premium in your interest as the Y variable. The coefficient for the X variable is our beta. Don't forget that in CAPM, you don't regress market return on stock return. You regress market risk premium on individual stock risk premium. AAPL N/A JPM N/A AMZN S&P500 N/A N/A AAPL JPM AMZN S&P500 Standard Deviation Beta O Month Risk Premium (%) January-01 February-01 March-01 April-01 May-01 June-01 July-01 August-01 September-01 October-01 November-01 December-01 January-02 February-02 March-02 April-02 May-02 June-02 July-02 August-02 + Return of your portfolio Risk premium of your portfolio N/A NA AAPL JPM AMZN S&P500 your portfolio Standard Deviation Beta Correlation w/ market S&P 500 AAPL JPM AMZN your portfolio Answer to portfolio std. and beta: Answer to correlation


