

Question
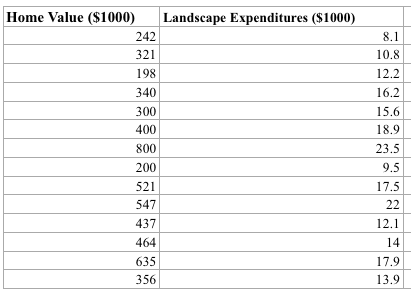
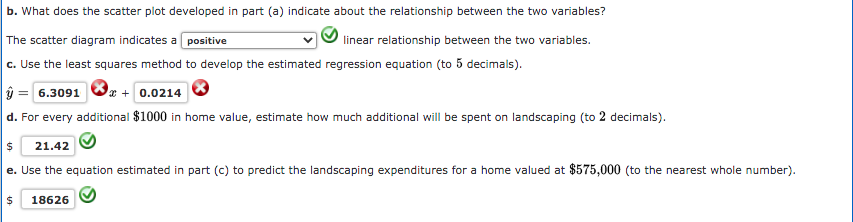
David's Landscaping has collected data on home values (in thousands of $) and expenditures (in thousands of $) on landscaping with the hope of developing
David's Landscaping has collected data on home values (in thousands of $) and expenditures (in thousands of $) on landscaping with the hope of developing a predictive model to help marketing to potential new clients. Data for14households may be found in the fileLandscape. Click on the datafile logo to reference the data.
Step by Step Solution
There are 3 Steps involved in it
Step: 1

Get Instant Access to Expert-Tailored Solutions
See step-by-step solutions with expert insights and AI powered tools for academic success
Step: 2

Step: 3
Ace Your Homework with AI
Get the answers you need in no time with our AI-driven, step-by-step assistance
Get Started
High School Math 2012 Common-core Algebra 2 Grade 10/11
Authors: Savvas Learning Co
Student Edition
9780133186024, 0133186024