Question
Day 5 - Linear Regression Is one's political affiliation likely to influence one's support for same-sex marriage? To answer our question, we conducted a survey
Day 5 - Linear Regression
Is one's political affiliation likely to influence one's support for same-sex marriage?
To answer our question, we conducted a survey of citizens in five U.S. states, to determine the percentage of adults who voted Democrat in the last election, and the percentage of adults who support the legalization of same-sex marriage.
After compiling our results, we discovered the following:
U.S. State Democratic Vote Same-Sex Support 20%
Alabama 30% 20%
Georgia 35% 30%
Wyoming 40% 40%
Ohio 50% 60%
New York 65% 90 %
- (a)From this data,extrapolatethe support of same-sex marriage among citizens in Texas (25% Democrats) and in California (60% Democrats). Explain how you arrived at your results.
- (b)Determine an equation for thelinear regression line. It will be of this form Marriage Support Rate =Democrat Rate?.
- (c)From the above equation (or from the above data), extrapolate the support of same-sex marriage among citizens in Utah (15% Democrats) and in Massachusetts (75% Democrats).
- What goes wrong?
- (d)Let?xand?xbe (respectively) the mean and standard deviation of the Democratic vote. Sim- ilarly, let?yand?ybe the mean and standard deviation of the Same-Sex Support Rate.
- We can show that?x=30+35+40+50+65= 445
- and?x=?(44?30)2+(44?35)2+(44?40)2+(44?50)2+(44?65)2= 13.87444.5?1
- Now run a similar calculation to determine the values of?yand?y.
Aregression linesummarizes the relationship between two variables, but only in a specific setting: when theexplanatoryvariablexhelps explain or predict theresponsevariabley.
There are many types of regression lines, but the one we will use is theleast-squaresregression line: this is the line that "comes closest" to passing through all of the points on ourscatterplot. More specifically, it is the line that makes the sum of the squares of the vertical distances of the data points from the line as small as possible.
Ifxis our explanatory variable, andyis our response variable, then the equation of the least- squares regression line is:
y=mx+b,withslopem=r?yandinterceptb=?y?m?x,?x
whereris thecorrelation coefficientof variablesxandy. And as we had before,?xand?yare the means ofxandy, and?xand?yare the standard deviations ofxandy.
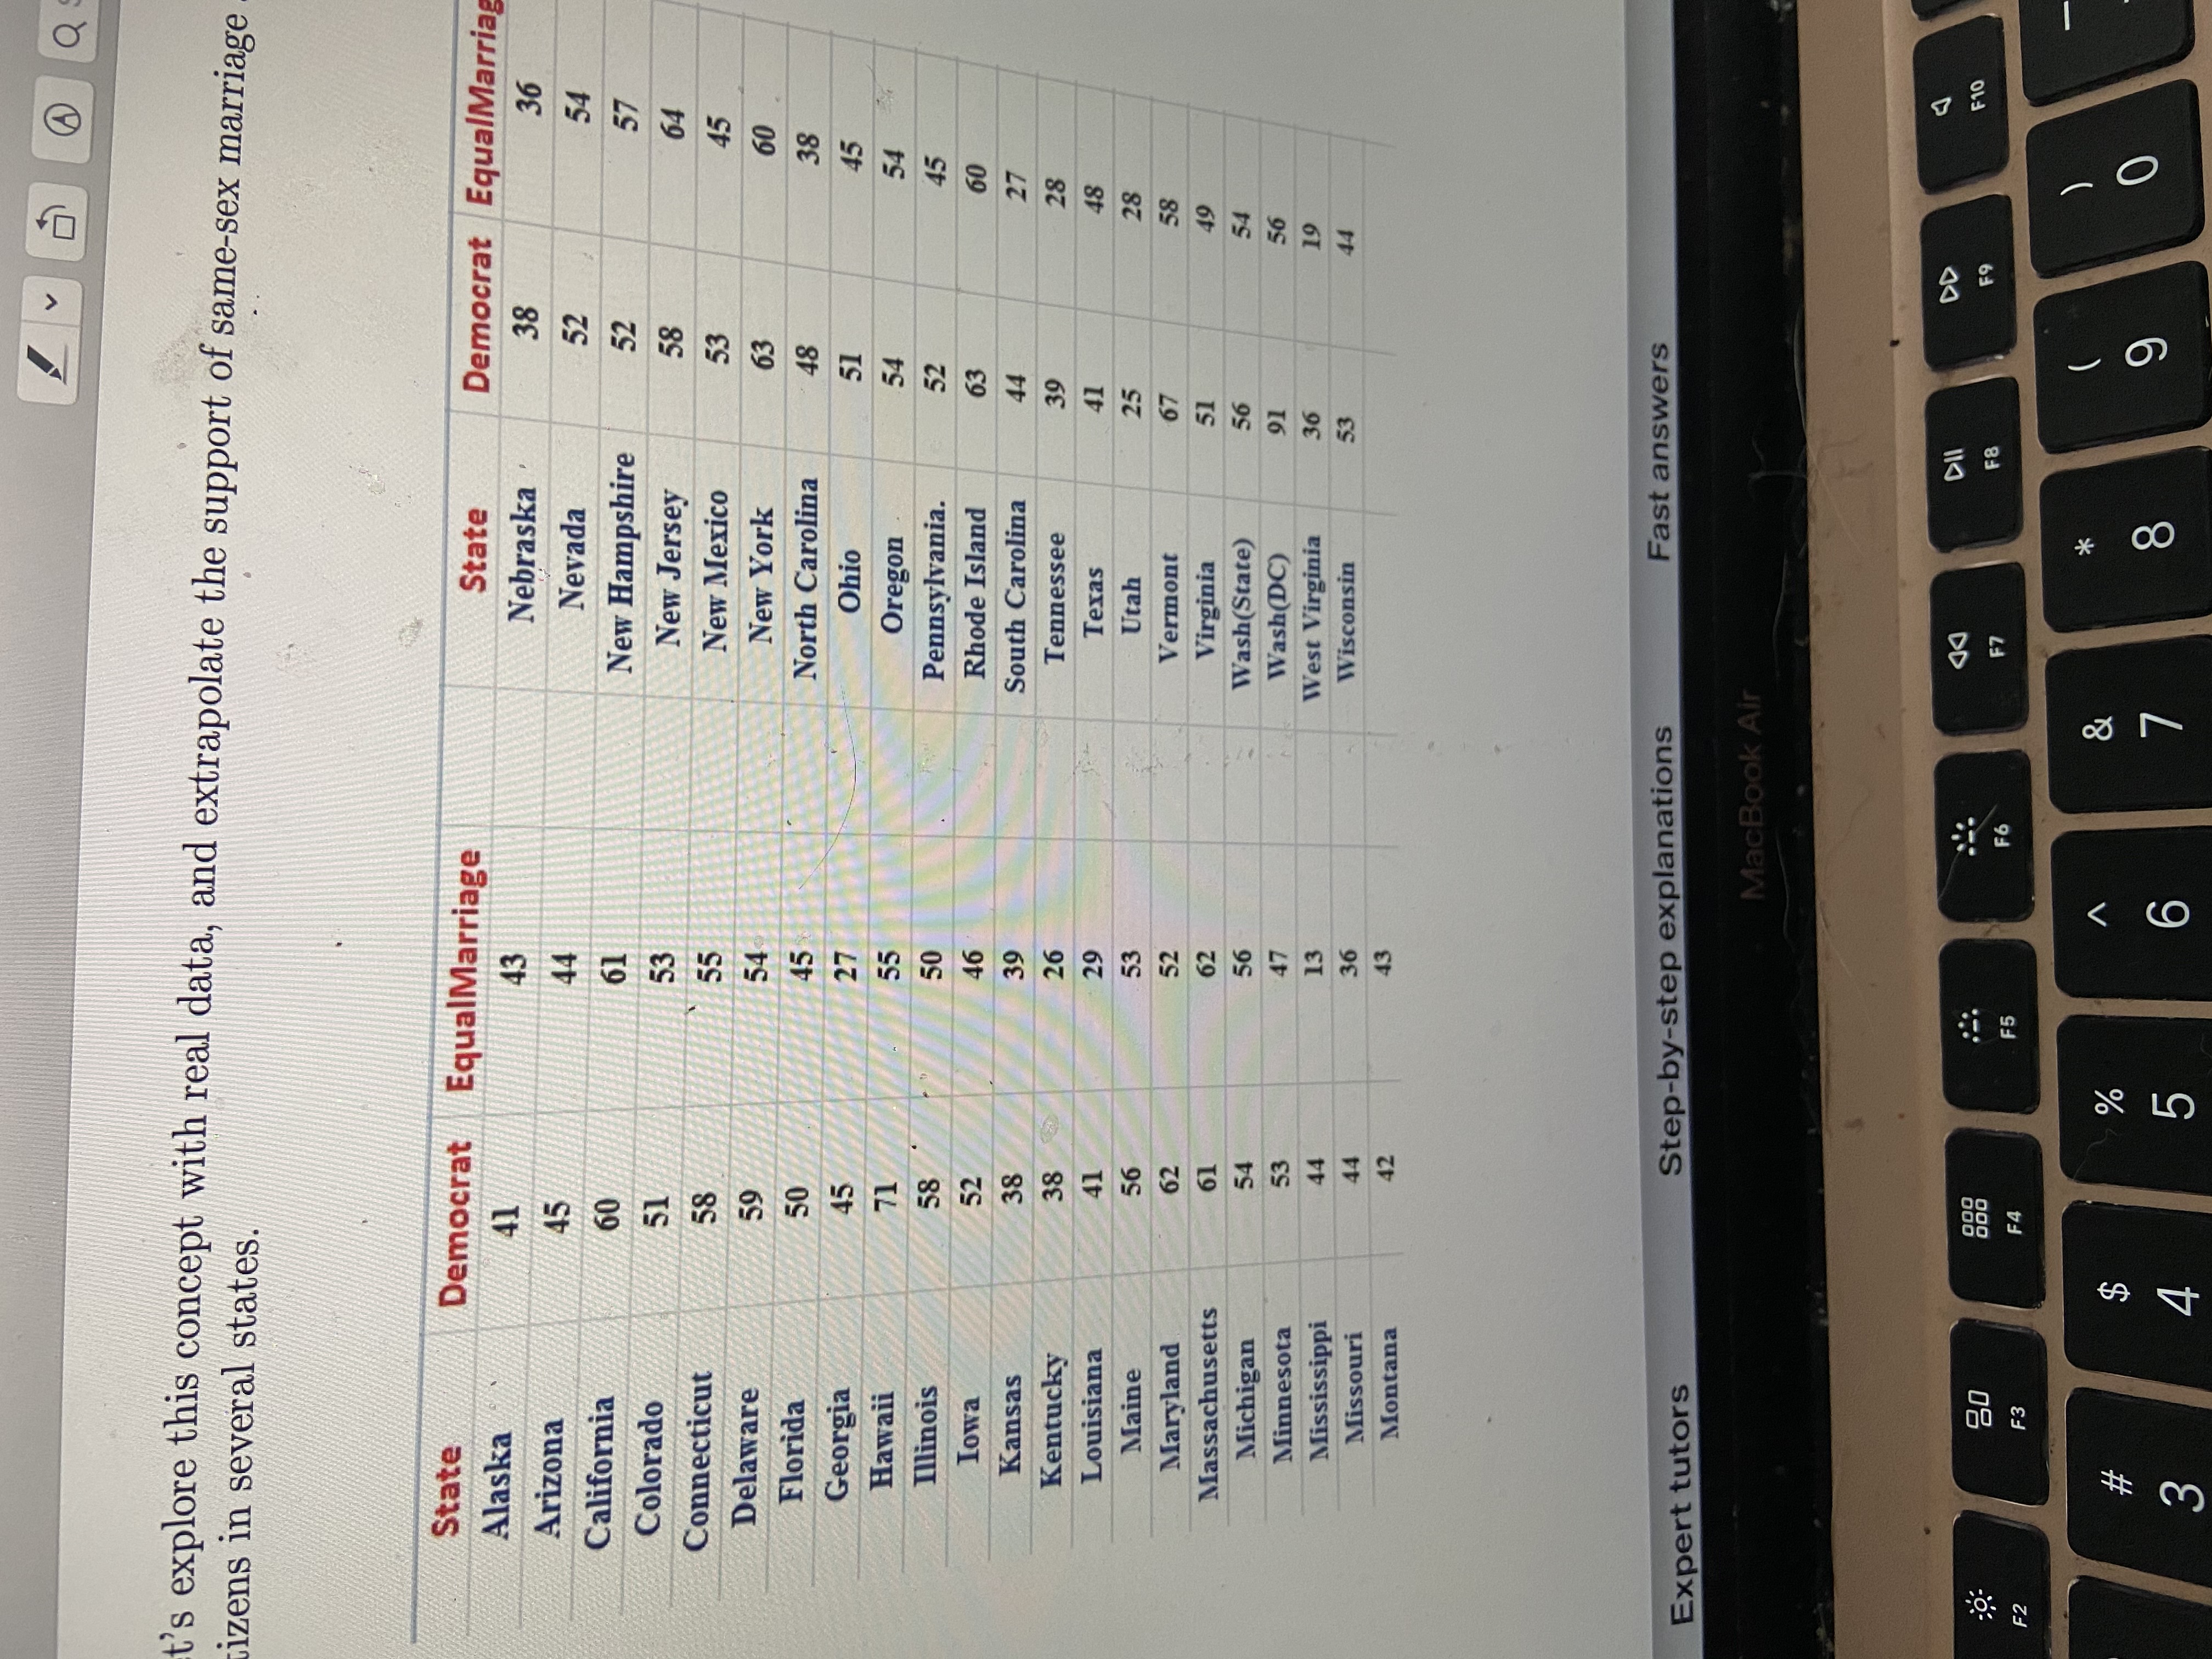
Let's explore this concept with real data, and extrapolate the support of same-sex marriage among citizens in several states.

Step by Step Solution
There are 3 Steps involved in it
Step: 1

Get Instant Access to Expert-Tailored Solutions
See step-by-step solutions with expert insights and AI powered tools for academic success
Step: 2

Step: 3

Ace Your Homework with AI
Get the answers you need in no time with our AI-driven, step-by-step assistance
Get Started


