

Answered step by step
Verified Expert Solution
Question
1 Approved Answer
DDROP DOWN OPTIONS ON THE RIGHT PART ARE: STRONG OR WEAK. THANKS. Comprehensive Ratio Analysis The Jimenez Corporation's forecasted 2019 financial statements follow, along with
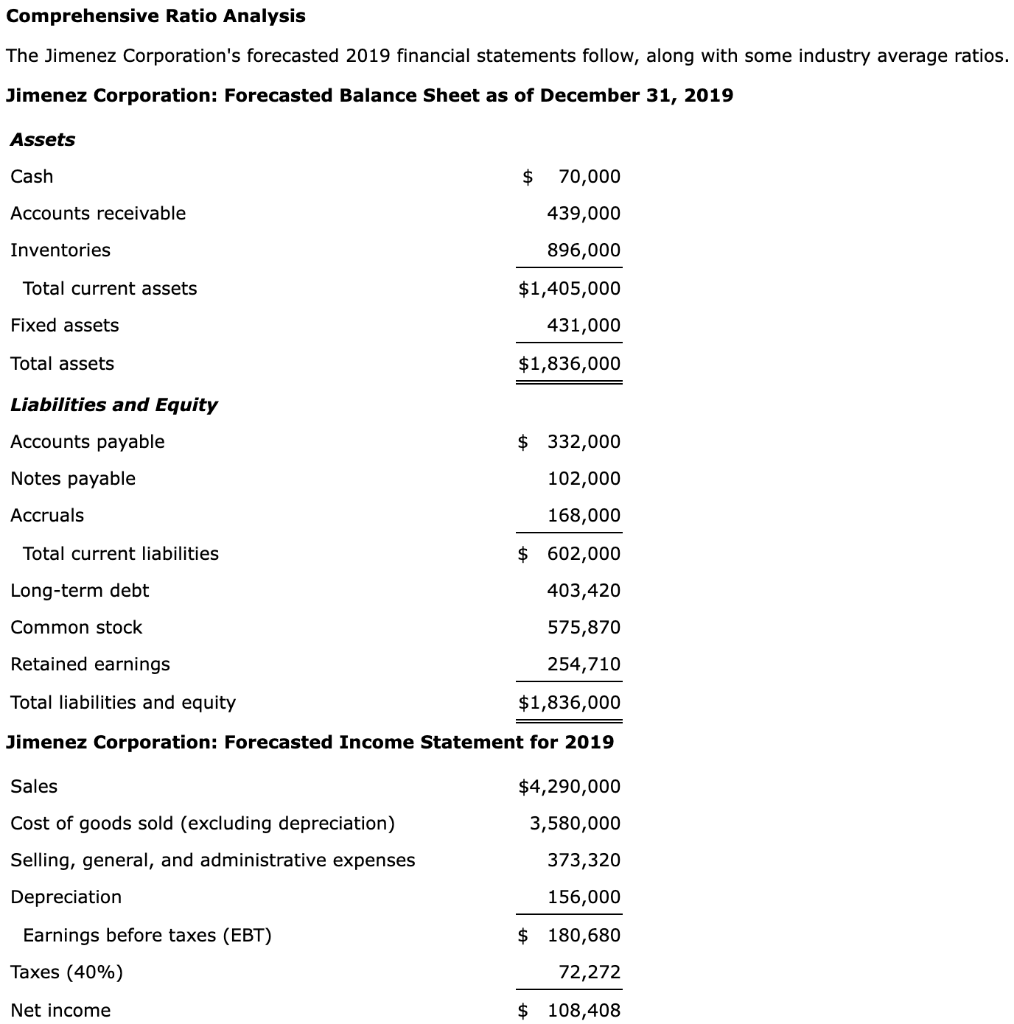
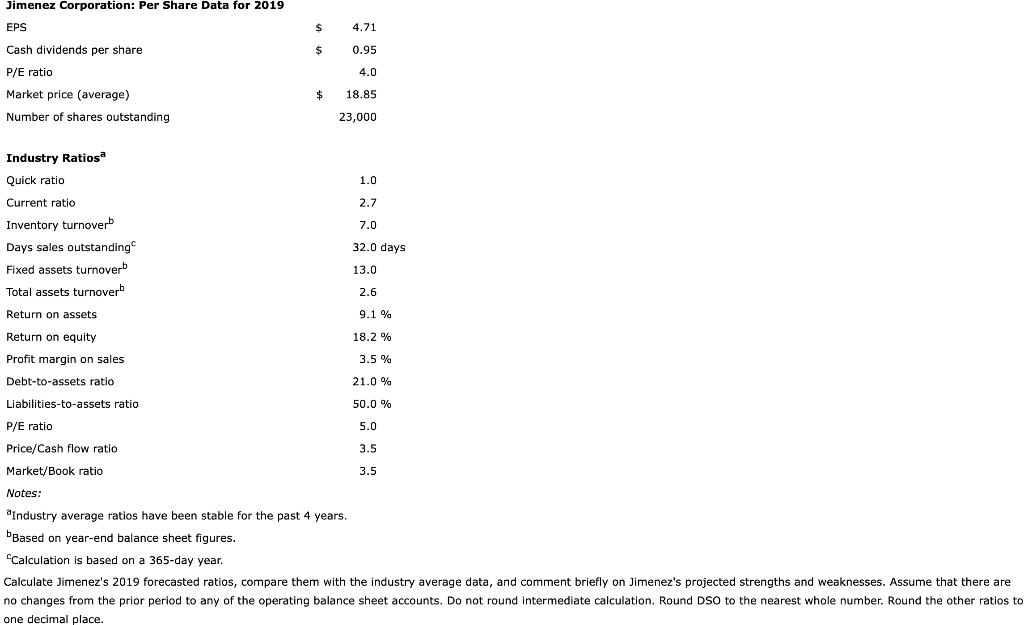
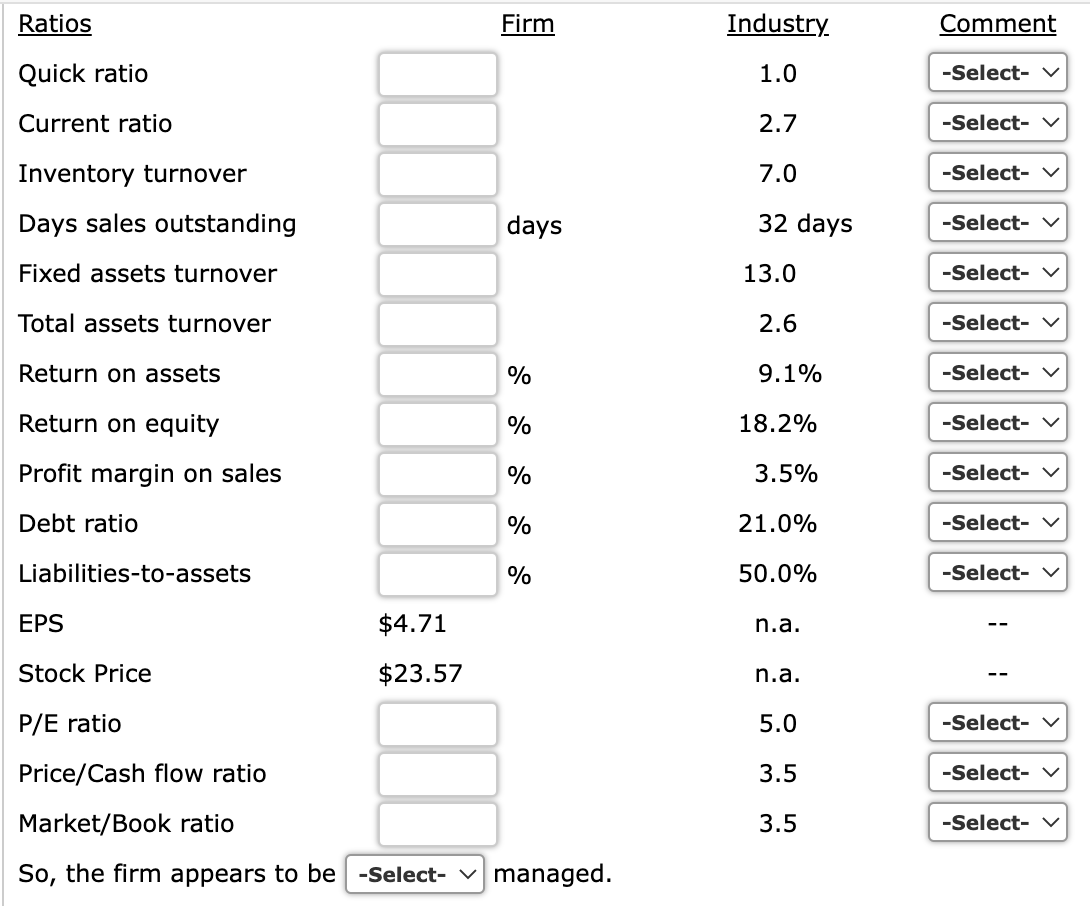 DDROP DOWN OPTIONS ON THE RIGHT PART ARE: STRONG OR WEAK. THANKS.
Step by Step Solution
There are 3 Steps involved in it
Step: 1

Get Instant Access to Expert-Tailored Solutions
See step-by-step solutions with expert insights and AI powered tools for academic success
Step: 2

Step: 3
Ace Your Homework with AI
Get the answers you need in no time with our AI-driven, step-by-step assistance
Get Started
Foundations of Financial Management
Authors: Stanley Block, Geoffrey Hirt, Bartley Danielsen
15th edition
77861612, 1259194078, 978-0077861612, 978-1259194078