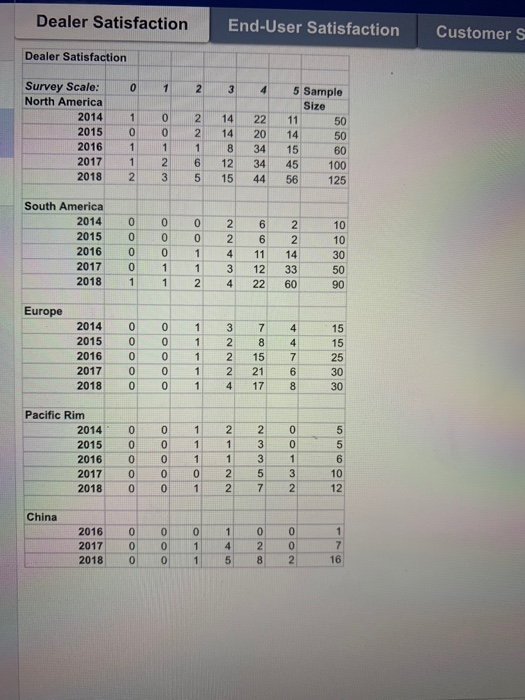
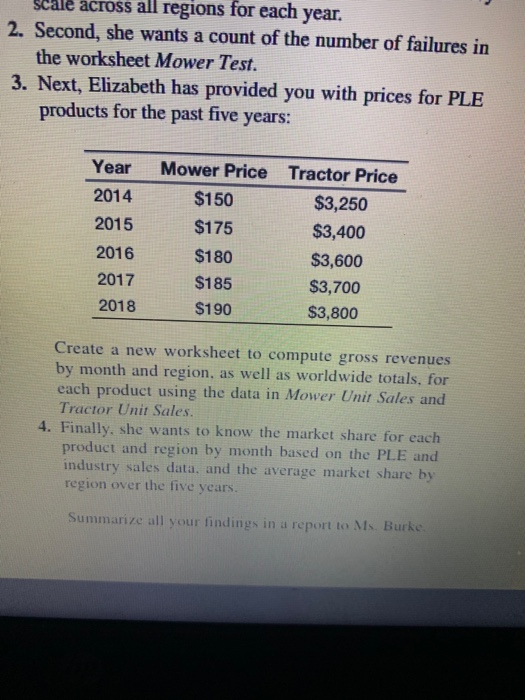
Dealer Satisfaction End-User Satisfaction Customer S Dealer Satisfaction 0 1 2 3 4 Survey Scale: North America 2014 2015 2016 2017 2018 1 0 1 1 2 NOO 2 2 1 6 14 14 8 12 15 22 20 34 34 44 5 Sample Size 11 50 14 50 15 60 45 100 56 125 3 South America 2014 2015 2016 2017 2018 OOOO OOO 0 0 1 1 2 2 2 4 3 4 6 6 11 12 22 2 2 14 33 60 10 10 30 50 90 1 1 1 Europe 3 2014 2015 2016 2017 2018 OOOOO 1 1 1 1 1 ANNN 7 8 15 21 17 4 4 7 6 8 15 15 25 30 30 Pacific Rim 2014 2015 2016 2017 2018 1 1 1 0 1 NNN 2 3 3 5 7 OOM Noon on 2 China 0 0 2016 2017 2018 0 0 0 0 0 1 1 1 4 5 0 2 8 0 0 2 1 7 16 across all regions for each year. 2. Second, she wants a count of the number of failures in the worksheet Mower Test. 3. Next, Elizabeth has provided you with prices for PLE products for the past five years: Year 2014 2015 2016 2017 2018 Mower Price Tractor Price $150 $3,250 $175 $3,400 $180 $3,600 $185 $3,700 $190 $3,800 Create a new worksheet to compute gross revenues by month and region, as well as worldwide totals, for each product using the data in Mower Unit Sales and Tractor Unit Sales. 4. Finally, she wants to know the market share for each product and region by month based on the PLE and industry sales data, and the average market share by region over the five years. Summarize all your findings in a report to Ms. Burke across all regions for each year. 2. Second, she wants a count of the number of failures in the worksheet Mower Test. 3. Next, Elizabeth has provided you with prices for PLE products for the past five years: Year 2014 2015 2016 2017 2018 Mower Price Tractor Price $150 $3,250 $175 $3,400 $180 $3,600 $185 $3,700 $190 $3,800 Create a new worksheet to compute gross revenues by month and region, as well as worldwide totals, for each product using the data in Mower Unit Sales and Tractor Unit Sales. 4. Finally, she wants to know the market share for each product and region by month based on the PLE and industry sales data, and the average market share by region over the five years. Summarize all your findings in a report to Ms. Burke Dealer Satisfaction End-User Satisfaction Customer S Dealer Satisfaction 0 1 2 3 4 Survey Scale: North America 2014 2015 2016 2017 2018 1 0 1 1 2 NOO 2 2 1 6 14 14 8 12 15 22 20 34 34 44 5 Sample Size 11 50 14 50 15 60 45 100 56 125 3 South America 2014 2015 2016 2017 2018 OOOO OOO 0 0 1 1 2 2 2 4 3 4 6 6 11 12 22 2 2 14 33 60 10 10 30 50 90 1 1 1 Europe 3 2014 2015 2016 2017 2018 OOOOO 1 1 1 1 1 ANNN 7 8 15 21 17 4 4 7 6 8 15 15 25 30 30 Pacific Rim 2014 2015 2016 2017 2018 1 1 1 0 1 NNN 2 3 3 5 7 OOM Noon on 2 China 0 0 2016 2017 2018 0 0 0 0 0 1 1 1 4 5 0 2 8 0 0 2 1 7 16 across all regions for each year. 2. Second, she wants a count of the number of failures in the worksheet Mower Test. 3. Next, Elizabeth has provided you with prices for PLE products for the past five years: Year 2014 2015 2016 2017 2018 Mower Price Tractor Price $150 $3,250 $175 $3,400 $180 $3,600 $185 $3,700 $190 $3,800 Create a new worksheet to compute gross revenues by month and region, as well as worldwide totals, for each product using the data in Mower Unit Sales and Tractor Unit Sales. 4. Finally, she wants to know the market share for each product and region by month based on the PLE and industry sales data, and the average market share by region over the five years. Summarize all your findings in a report to Ms. Burke across all regions for each year. 2. Second, she wants a count of the number of failures in the worksheet Mower Test. 3. Next, Elizabeth has provided you with prices for PLE products for the past five years: Year 2014 2015 2016 2017 2018 Mower Price Tractor Price $150 $3,250 $175 $3,400 $180 $3,600 $185 $3,700 $190 $3,800 Create a new worksheet to compute gross revenues by month and region, as well as worldwide totals, for each product using the data in Mower Unit Sales and Tractor Unit Sales. 4. Finally, she wants to know the market share for each product and region by month based on the PLE and industry sales data, and the average market share by region over the five years. Summarize all your findings in a report to Ms. Burke