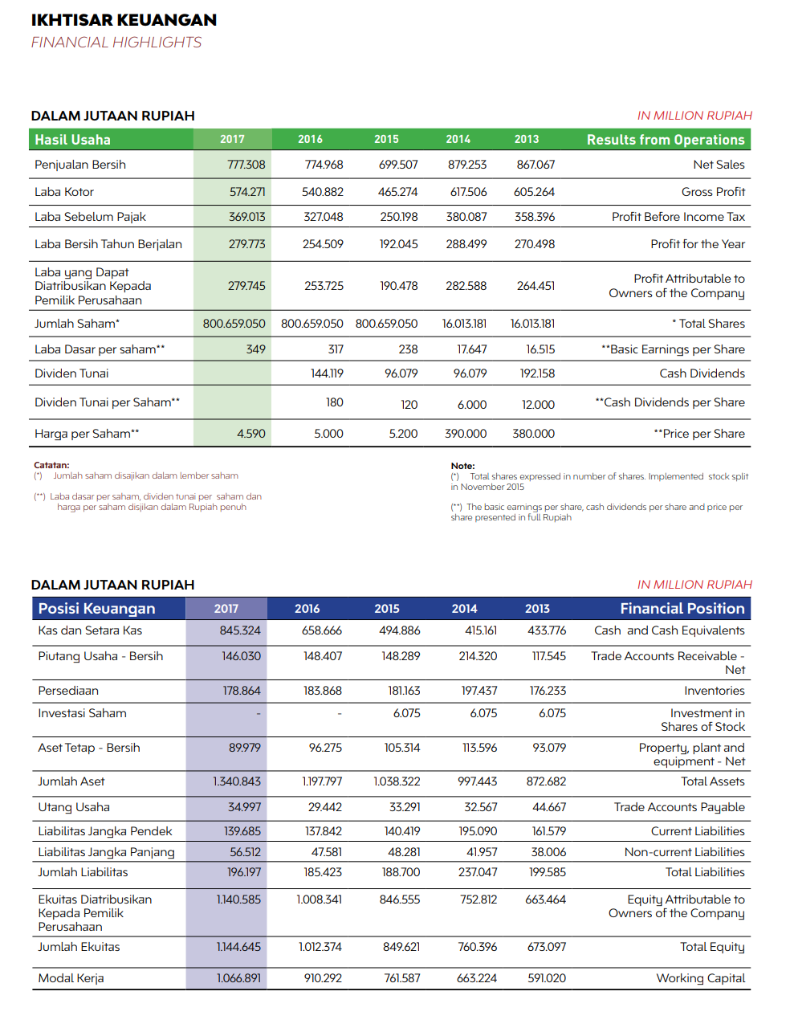
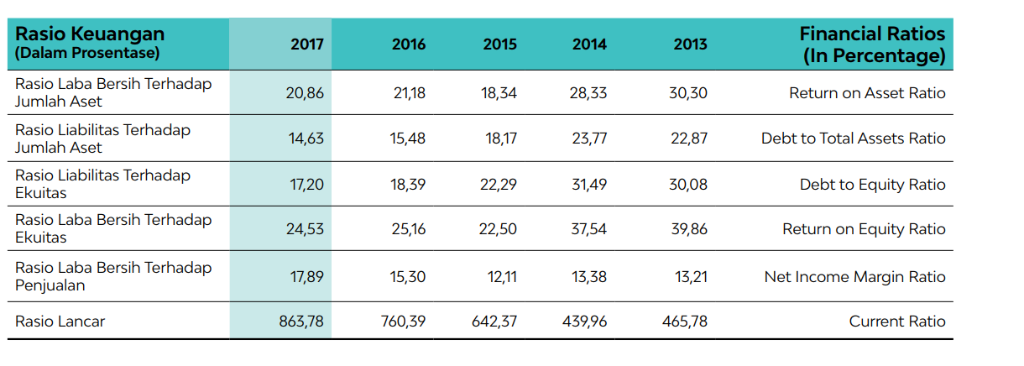
Dear Chegg Expert, Below are the financial highlights of GeoTronic company for the last 5 years
Task:
1. Perform DuPont analysis only in the year 2017 & 2016 2. Perform Capital Structure Analysis only in the year 2017 & 2016
And give your explanation
Thank you


IKHTISAR KEUANGAN FINANCIAL HIGHLIGHTS DALAM JUTAAN RUPIAH IN MILLION RUPIAH 2013 777.308 574.271 369.013 279.773 Results from Operations Net Sales Gross Profit Profit Before Income Tax Profit for the Year Profit Attributable to 699.507879.253 867067 Laba Kotor Laba Sebelum Pajak Laba Bersih Tahun Berjalan Laba yang Dapat Pemilik Perusahaan Jumlah Saham Laba Dasar per saham" Dividen Tunai Dividen Tunai per Saham Harga 540.882 617.506605.264 327048 250.198 380.087 92045 288.499 270.498 279.745 253.725 190.478 282.588 264.451 Owners of the Company Total Shares hare Cash Dividends Cash Dividends per Share 800.659.050 800.659.050 800.659050 6.13181 6.013.181 7.647 96.079 317 16.515 Basic Earnings per S 96079 120 5.200 12.000 4590 390.000 380.000 Jumlah saham disajikan dalam lember saham Total shares expressed in number of shares Implemented stock split (") Laba dasar per saham, dividen tunai per saham dan harga per saham disjikan dalam Rupiah penuh The basic eamings per share, cash dividends per share and price per share presented in full Rupiah DALAM JUTAAN RUPIAH IN MILLION RUPIAH Posisi Keuangan Kas dan Setara Kas Financial Position 3.776 Cash and Cash Equivalents 2016 2014 494.886 48.289 181.163 6.075 845.324 658.666 415.161 433 Piutang Usaha - Bersih 7545 Trade Accounts Receivable 78.864 83.868 176.233 tasi in Shares of Stock Aset Tetap Bersih 89979 96.275 1.197.797 29442 137.842 13.596 93.079 Property, plant and 340.843 34.997 139.685 56.512 196.197 1140.585 Net Total Assets Trade Accounts Payable Current Liabilities Non-current Liabilities Total Liabilities 1038.322 Jumlah Aset Utang Liabilitas Jangka Pendek Liabilitas Jangka Panjang Jumlah Liabilitas Ekuitas Diatribusikan 997443872.682 33.291 161 579 38.006 237047 199585 752.812 663464 95.090 41.957 48.281 188.700 1.008.341 846.555 Equity Attributable to Owners of the Company h Ekuitas 144.645 1012.374 849.621 760.396 673.097 Total Equity 1.066.891 761.587 Rasio Keuangan (Dalam Prosentase) Financial Ratios (In Percentage Return on Asset Ratio 2017 2016 2015 2014 2013 Rasio Laba Bersih Terhadap Jumlah Aset 20,86 14,63 17,20 24,53 17,89 863,78 18,34 18,17 22,29 22,50 12,11 642,37 28,33 23,77 31,49 37,54 30,30 22,87 30,08 39,86 13,21 465,78 21,18 Rasio Liabilitas Terhadap Jumlah Aset 15,48 Debt to Total Assets Ratio Rasio Liabilitas Terhadap Ekuitas 18,39 25,16 15,30 760,39 Debt to Equity Ratio Return on Equity Ratio Net Income Margin Ratio Rasio Laba Bersih Terhadap Ekuitas Rasio Laba Bersih Terhadap Penjualan 13,38 Rasio Lancar 439,96 Current Ratio


