Question
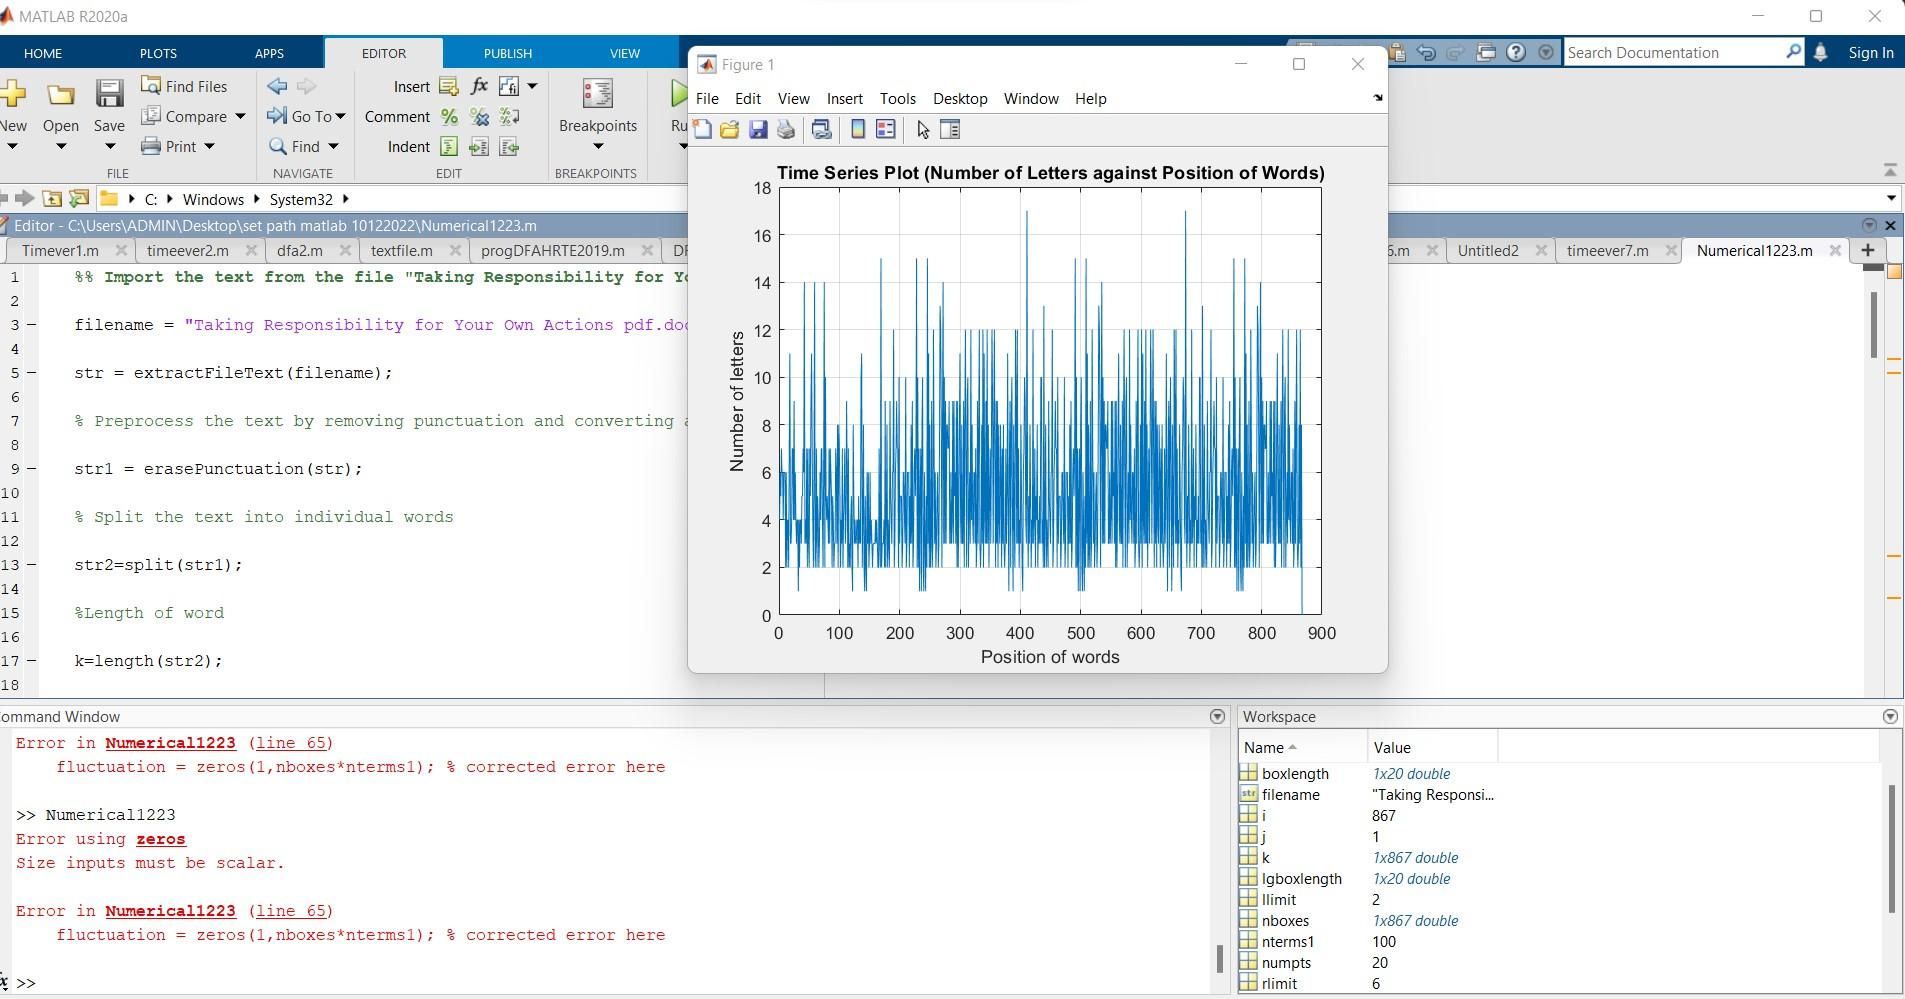
Dear Expert this is the MATLAB program for the Detrended fluctuation analysis for a text. There is an error still at 'fluctuation = zeros(1,k); %
Dear Expert this is the MATLAB program for the Detrended fluctuation analysis for a text. There is an error still at 'fluctuation = zeros(1,k); % corrected error here' when running the program on Matlab ONLINE I get the following:

Even though with the below explanation we are obtaining the same mistake as the previous version. Please can you give it another try and TEST IT IF IT WORKS I wanna Know if it is working your side Can you show me your graph how it will become please . I don't understand what to change here also . Please please can you give it a try till the graph of log is obtained. Thank you very much and sorry I can understand its a bit irritating. BUT FOR SURE WE NEED A SCALAR AT LINE 65 IF WE ARE USING THE ZEROS FUNCTION.IS THERE NO ALTERNATIVE TO IT PLEASE. do check the results before posting sir/Madam. Thank you
{EXPLANATION)
Regarding the error you mentioned, the problem seems to be with the line:
fluctuation = zeros(1,k);
Here, the size of the fluctuation array is being set to [1,k], which is causing the error. Since k is a scalar value, this should be the size of the array. Instead, you should set the size to [1,nboxes*nterms1], which is the maximum size that the array can have. So the corrected line should be:
fluctuation = zeros(1,nboxes*nterms1);}
%% Import the text from the file "Taking Responsibility for Your Own Actions pdf.docx"
filename = "Taking Responsibility for Your Own Actions pdf.docx";
str = extractFileText(filename);
% Preprocess the text by removing punctuation and converting all characters to lowercase
str1 = erasePunctuation(str);
% Split the text into individual words
str2=split(str1);
%Length of word
k=length(str2);
%Number of words
x=[1:k];
% Map each word to its corresponding index of length
for i=x:k
k(i) = strlength(str2(i));
end
y = k;
%Plot the random walk time series
figure(1)
plot(x,y)
title('Time Series Plot (Number of Letters against Position of Words)')
xlabel('Position of words')
ylabel('Number of letters')
grid on
numpts=20;
llimit=2;
rlimit=6;
lgboxlength=linspace(llimit,rlimit,numpts);
boxlength= floor(10.^lgboxlength);
%% Calc Fluctuation for each Boxlength s and calc Fsquared
for j= 1:numpts
nterms1=boxlength(j);
nboxes=floor(kterms1);
fluctuation = zeros(1,nboxes*nterms1); % corrected error here
trend = zeros(1,nboxes*nterms1); % added missing initialization
%% Calc Trend in Each box of length s and calc Fsquared
for i=1:nboxes
start =(i-1)*nterms1+1;
finish=i*nterms1;
x=[start:finish];
a=polyfit(x,y(start:finish),1);
trend_segment=a(1)*x+a(2);
trend(start:finish)=trend_segment;
fluctuation(start:finish)=y(start:finish)-trend_segment;
end
f(j)=sqrt(mean(fluctuation .^2));
end
%% plotting the log-log Graph
figure(2) % corrected error here
plot(log10(boxlength),log10(f),'+k-')
title('Detrended Time Series Plot (Number of Letters against Position of Words)')
xlabel('Logarithm of box length')
ylabel('Logarithm of fluctuation')
grid on
Error in Numerical1223 (line 65) fluctuation = zeros (1, nboxes nterms 1); corrected error here Numerical1223 Error using zeros Size inputs must be scalar. Error in Numerical1223 (line 65) fluctuation = zeros (1, nboxes nterms1); corrected error hereStep by Step Solution
There are 3 Steps involved in it
Step: 1

Get Instant Access to Expert-Tailored Solutions
See step-by-step solutions with expert insights and AI powered tools for academic success
Step: 2

Step: 3

Ace Your Homework with AI
Get the answers you need in no time with our AI-driven, step-by-step assistance
Get Started


