Debt/Equity Ratio Question Answer Choices: Not Given, 3.31 or 30.24
Which is better? Lowes or Home Depot
Home Depot Key Ratios
 Lowe's Key Ratios
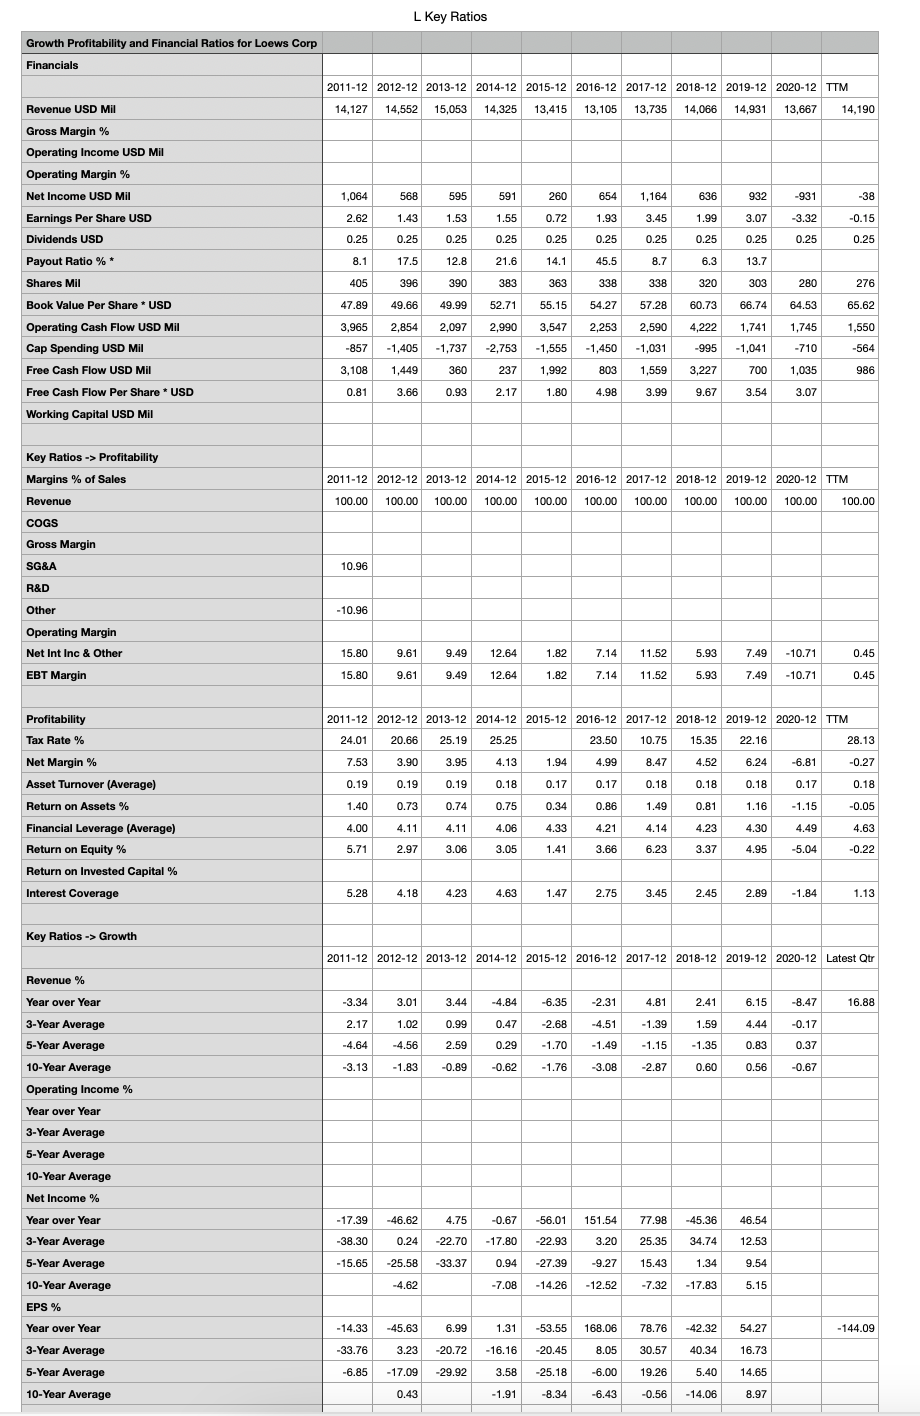
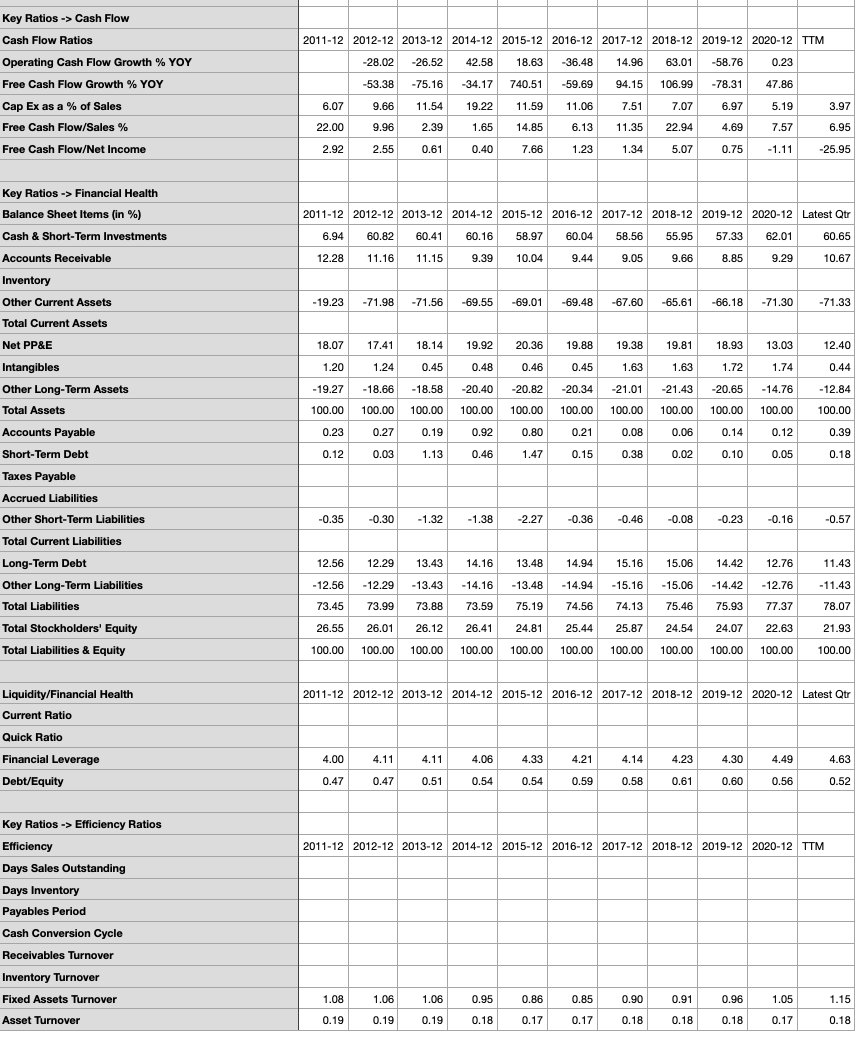
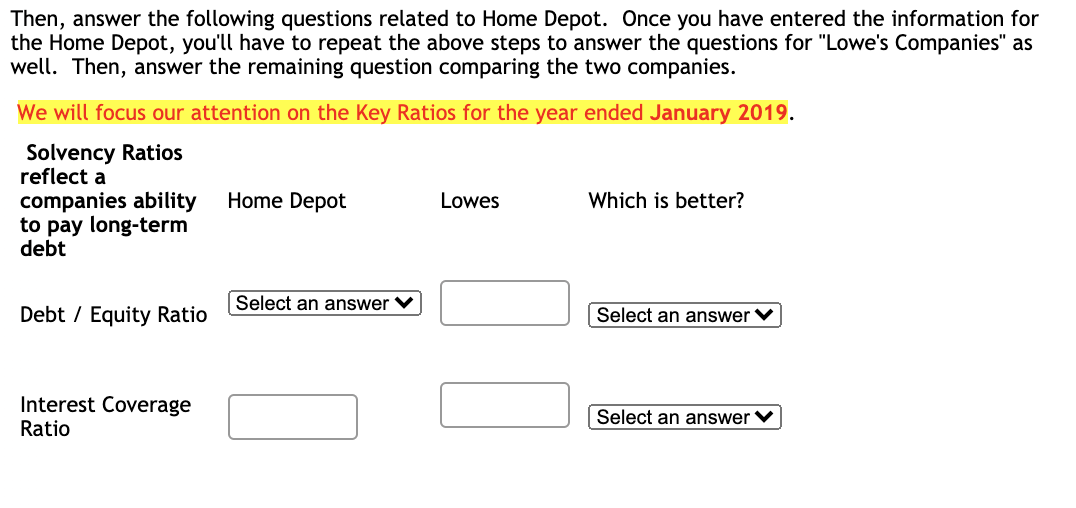
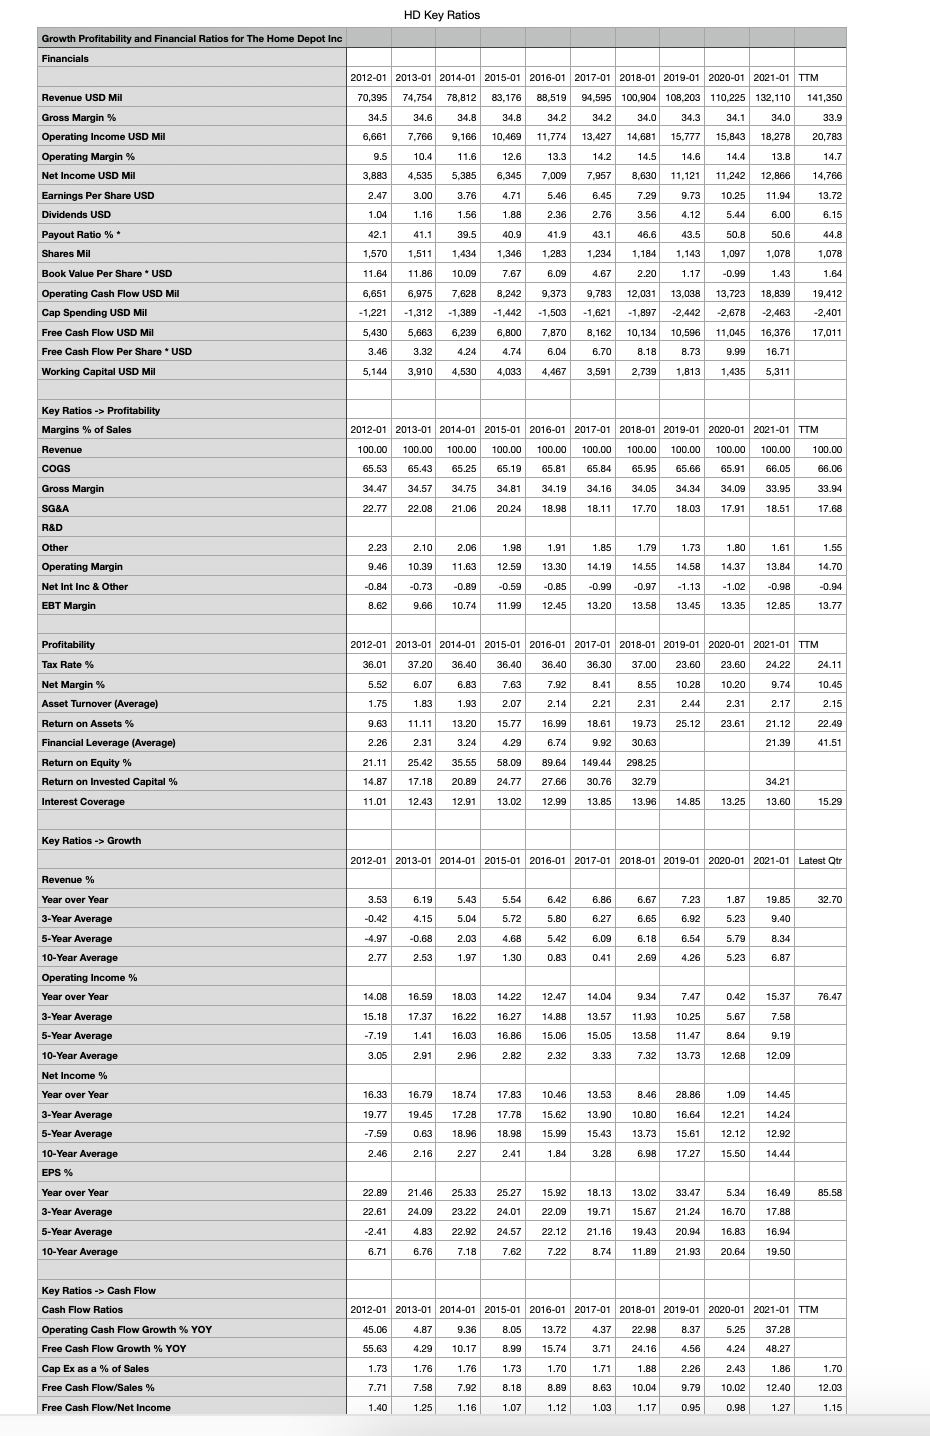
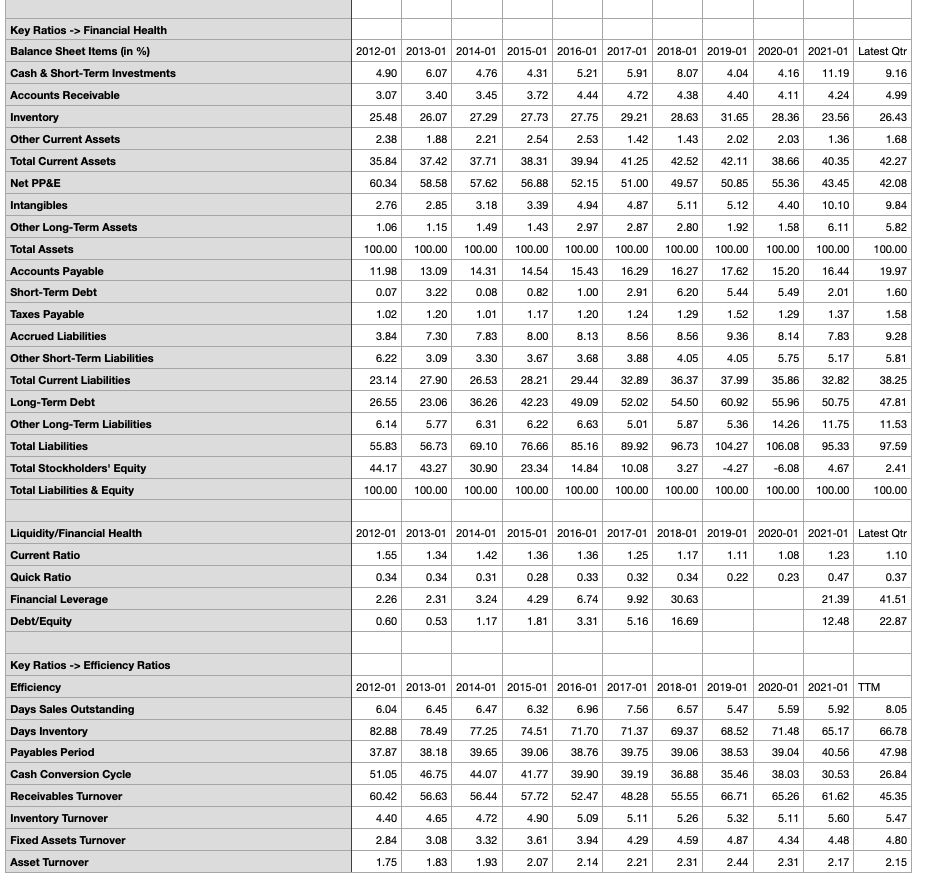
Then, answer the following questions related to Home Depot. Once you have entered the information for the Home Depot, you'll have to repeat the above steps to answer the questions for "Lowe's Companies" as well. Then, answer the remaining question comparing the two companies. We will focus our attention on the Key Ratios for the year ended January 2019. Solvency Ratios reflect a companies ability Home Depot Lowes Which is better? to pay long-term debt Select an answer V Debt / Equity Ratio Select an answer Interest Coverage Ratio Select an answer HD Key Ratios Growth Profitability and Financial Ratios for The Home Depot Inc Financials 2012-01 2013-01 2014-01 2015-01 2016-01 2017-01 2018-01 2019-01 2020-01 2021-01 TTM Revenue USD Mil 70,395 74,754 78,812 83,176 88,519 94,595 100,904 108,203 110,225 132, 110 141,350 Gross Margin % 34.5 34.6 34.8 34.8 34.2 34.2 34.0 34.3 34.1 34.0 33.9 Operating Income USD Mil 6,661 7,766 9,166 10,469 11,774 13,427 14,681 15,777 15,843 18,278 20,783 Operating Margin % 9.5 10.4 11.6 12.6 13.3 14.2 14.5 14.6 14.4 13.8 14.7 Net Income USD Mil 3,883 4.535 5,385 6,345 7.009 7.957 8.630 11.121 11,242 12,866 14,766 Earnings Per Share USD 2.47 3.00 3.76 4.71 5.46 6.45 7.29 9.73 10.25 11.94 13.72 Dividends USD 1.04 1.16 1.56 1.8.8 2.36 2.76 3.56 4.12 5.44 6.00 6.15 Payout Ratio % 42.1 41.1 39.5 40.9 41.9 43.1 46.6 43.5 50.8 50.6 44.8 Shares Mil 1,570 1,511 1,434 1,346 1,283 1,234 1.184 1.143 1.097 1,078 1,078 Book Value Per Share * USD 11.64 11.86 10.09 7.67 6.09 4.67 2.20 1.17 -0.99 1.43 1.64 Operating Cash Flow USD Mil 6,651 6,975 7.628 8,242 9,373 9,783 12.031 13,038 13,723 18,839 19,412 Cap Spending USD Mil - 1,221 -1,312 -1,389 -1,442 -1,503 -1,621 -1,897 -2.442 -2,678 -2,463 -2,401 Free Cash Flow USD Mil 5,430 5,663 6,239 6,800 7,870 8.162 10,134 10,596 11.045 16,376 17.011 Free Cash Flow Per Share * USD 3.46 3.32 4.24 4.74 6.04 6.70 8.18 8.73 9.99 16.71 Working Capital USD Mil 5,144 3,910 4,530 4,033 4,467 3,591 2.739 1,813 1,435 5,311 Key Ratios -> Profitability Margins % of Sales % Revenue COGS 2012-01 2013-01 2014-01 2015-01 2016-01 2017-01 2018-01 2019-01 2020-01 2021-01 TTM 100.00 100.00 100.00 100.00 100.00 100.00 100.00 100.00 100.00 100.00 100.00 65.53 65.43 65.19 65.84 65.95 65.66 65.91 66.05 66.06 34.47 34.57 34.75 34.81 34.19 34.16 34.05 34.34 34.09 33.95 33.94 22.77 22.08 20.24 18.98 18.11 17.70 18.03 17.91 18.51 17.68 65.25 65.81 Gross Margin SG&A 21.06 R&D Other 2.23 2.10 2.06 1.98 1.91 1.85 1.79 1.73 1.80 1.61 1.55 9.46 10.39 11.63 12.59 13.30 14.19 14.55 14.58 14.37 13.84 14.70 Operating Margin Net Int Inc & Other & EBT Margin -0.84 -0.73 -0.89 -0.59 -0.85 -0.99 -0.97 -1.13 -1.02 -0.98 -0.94 8.62 9.66 10.74 11.99 12.45 13.20 13.58 13.45 13.35 12.85 13.77 Profitability Tax Rate % Net Margin % Asset Turnover (Average) Return on Assets % Financial Leverage (Average) 2012-01 2013-01 2014-01 2015-01 2016-01 2017-01 2018-01 2019-01 2020-01 2021-01 TTM 36.01 37.20 36.40 36.40 36.40 36.30 37.00 23.60 23.60 24.22 24.11 5.52 6.07 6.83 7.63 7.92 8.41 8.55 10.28 10.20 9.74 10.45 1.75 1.83 1.93 2.07 2.14 2.21 2.31 2.44 2.31 2.17 2.15 9.63 11.11 13.20 15.77 16.99 18.61 19.73 25.12 23.61 21.12 22.49 2.26 2.31 3.24 4.29 6.74 9.92 30.63 21.39 41.51 21.11 25.42 35.55 58.09 89.64 149.44 298.25 14.87 17.18 20.89 24.77 27.66 30.76 32.79 34.21 11.01 12.43 12.91 13.02 12.99 13.85 13.96 14.85 13.25 13.60 15.29 Return on Equity % Return on Invested Capital % Interest Coverage Key Ratios -> Growth -> 2012-01 2013-01 2014-01 2015-01 2016-01 2017-01 2018-01 2019-01 2020-01 2021-01 Latest Qtr Revenue % 3.53 6.19 5.43 5.54 6.42 6.86 6.67 7.23 1.87 19.85 32.70 Year over Year 3-Year Average - 5-Year Average -0.42 4.15 5.04 5.72 5.80 6.27 6.65 6.92 5.23 9.40 -4.97 -0.68 2.03 4.68 5.42 6.09 6.18 6.54 5.79 8.34 2.77 2.53 1.97 1.30 0.83 0.41 2.69 4.26 5.23 6.87 14.08 16.59 18.03 14.22 12.47 14.04 9.34 7.47 0.42 15.37 76.47 15.18 16.22 16.27 14.88 13.57 11.93 10.25 5.67 7.58 17.37 1.41 -7.19 16.03 16.86 15.06 15.05 13.58 11.47 8.64 9.19 3.05 2.91 2.96 2.82 2.32 3.33 7.32 13.73 12.68 12.09 16.33 16.79 18.74 17.83 10.46 13.53 8.46 28.86 1.09 14.45 10-Year Average Operating Income % Year over Year 3-Year Average 5-Year Average 5- 10-Year Average Net Income % Year over Year 3-Year Average 5-Year Average 10-Year Average EPS % Year over Year 3-Year Average 5-Year Average 10-Year Average 19.77 17.28 17.78 15.62 13.90 10.80 16.64 12.21 14.24 19.45 0.63 -7.59 18.96 18.98 15.99 15.43 13.73 15.61 12.12 12.92 14.44 2.46 2.16 2.27 2.41 1.84 3.28 6.98 17.27 15.50 22.89 21.46 25.33 25.27 15.92 13.02 33.47 5.34 16.49 85.58 18.13 19.71 22.61 24.09 23.22 24.01 22.09 15.67 21.24 16.70 17.88 -2.41 4.83 22.92 24.57 22.12 21.16 19.43 20.94 16.83 16.94 6.71 6.76 7.18 7.62 7.22 8.74 11.89 21.93 20.64 19.50 Key Ratios -> Cash Flow Cash Flow Ratios Operating Cash Flow Growth % YOY Free Cash Flow Growth % YOY Cap Ex as a % of Sales a Free Cash Flow/Sales % % Free Cash Flow/Net Income 2012-01 2013-01 2014-01 2015-01 2016-01 2017-01 2018-01 2019-01 2020-01 2021-01 TTM 45.06 4.87 9.36 8.05 13.72 4.37 22.98 8.37 5.25 37.28 55.63 4.29 10.17 8.99 15.74 3.71 24.16 4.56 4.24 48.27 1.73 1.76 1.76 1.73 1.70 1.71 1.88 2.26 2.43 1.86 1.70 7.71 7.58 7.92 8.18 8.89 8.63 10.04 9.79 12.40 12.03 10.02 1.40 1.25 1.16 1.07 1.12 1.03 1.17 0.95 0.98 1.27 1.15 2012-01 2013-01 2014-01 2015-01 2016-01 2017-01 2018-01 2019-01 2020-01 2021-01 Latest Qtr 4.90 6.07 4.76 4.31 5.21 5.91 8.07 4.04 4.16 11.19 9.16 3.07 3.40 3.45 3.72 4.44 4.72 4.38 4.40 4.11 4.24 4.99 25.48 26.07 27.29 27.73 27.75 29.21 28.63 31.65 28.36 23.56 26.43 2.38 1.88 2.21 2.54 2.53 1.42 1.43 2.02 2.03 1.36 1.68 35.84 37.42 37.71 38.31 39.94 41.25 42.52 42.11 38.66 40.35 42.27 60.34 58.58 57.62 56.88 52.15 51.00 49.57 50.85 55.36 43.45 42.08 2.76 2.85 3.18 3.39 4.94 4.87 5.11 5.12 4.40 10.10 9.84 1.06 1.15 1.49 1.43 2.97 2.87 2.80 1.92 1.58 6.11 5.82 100.00 100.00 100.00 100.00 100.00 100.00 100.00 100.00 100.00 100.00 100.00 Key Ratios -> Financial Health Balance Sheet Items (in %) Cash & Short-Term Investments Accounts Receivable Inventory Other Current Assets Total Current Assets Net PP&E Intangibles Other Long-Term Assets Total Assets Accounts Payable Short-Term Debt Taxes Payable Accrued Liabilities Other Short-Term Liabilities Total Current Liabilities Long-Term Debt Other Long-Term Liabilities Total Liabilities Total Stockholders' Equity Total Liabilities & Equity 11.98 13.09 14.31 14.54 15.43 16.29 16.27 17.62 15.20 16.44 19.97 0.07 3.22 0.08 0.82 1.00 2.91 6.20 5.44 5.49 2.01 1.60 1.02 1.20 1.01 1.17 1.20 1.24 1.29 1.52 1.29 1.37 1.58 3.84 7.30 7.83 8.00 8.13 8.56 8.56 9.36 8.14 7.83 9.28 6.22 3.09 3.30 3.67 3.68 3.88 4.05 4.05 5.75 5.17 5.81 23.14 27.90 26.53 28.21 29.44 32.89 36.37 37.99 35.86 32.82 38.25 26.55 23.06 36.26 42.23 49.09 52.02 54.50 60.92 55.96 50.75 47.81 6.14 5.77 6.31 6.22 6.63 5.01 5.87 5.36 14.26 11.75 11.53 55.83 89.92 96.73 104.27 106.08 95.33 97.59 56.73 69.10 76.66 85.16 43.27 30.90 23.34 14.84 100.00 100.00 100.00 100.00 44.17 100.00 2.41 10.08 100.00 3.27 -4.27 -6.08 4.67 100.00 100.00 100.00 100.00 100.00 2012-01 2013-01 2014-01 2015-01 2016-01 2017-01 2018-01 2019-01 2020-01 2021-01 Latest Qtr 1.36 1.08 1.55 1.34 1.42 1.36 1.25 1.17 1.11 1.23 1.10 Liquidity/Financial Health Current Ratio Quick Ratio Financial Leverage Debt/Equity 0.34 0.34 0.31 0.28 0.33 0.32 0.34 0.22 0.23 0.47 0.37 2.26 2.31 3.24 4.29 6.74 9.92 30.63 21.39 41.51 0.60 0.53 1.17 1.81 3.31 5.16 16.69 12.48 22.87 2012-01 2013-01 2014-01 2015-01 2016-01 2017-01 2018-01 2019-01 2020-01 2021-01 TTM 6.04 6.45 6.47 6.32 6.96 7.56 6.57 5.47 5.59 5.92 8.05 82.88 78.49 77.25 74.51 71.70 71.37 69.37 68.52 71.48 65.17 66.78 37.87 38.18 39.65 39.06 38.76 39.75 39.06 38.53 39.04 40.56 47.98 Key Ratios -> Efficiency Ratios Efficiency Days Sales Outstanding Days Inventory Payables Period Cash Conversion Cycle Receivables Turnover Inventory Turnover Fixed Assets Turnover Asset Turnover 51.05 46.75 44.07 41.77 39.90 39.19 36.88 35.46 38.03 30.53 26.84 60.42 56.63 56.44 57.72 52.47 48.28 55.55 66.71 65.26 61.62 45.35 4.40 4.65 4.72 4.90 5.09 5.11 5.26 5.32 5.11 5.60 5.47 2.84 3.08 3.32 3.61 3.94 4.29 4.59 4.87 4.34 4.48 4.80 1.75 1.83 1.93 2.07 2.14 2.21 2.31 2.44 2.31 2.17 2.15 L Key Ratios Growth Profitability and Financial Ratios for Loews Corp Financials 2011-12 2012-12 2013-12 2014-12 2015-12 2016-12 2017-12 2018-12 2019-12 2020-12 TTM 14,127 14,552 15,053 14,325 13,415 13,105 13,735 14,066 14,931 13,667 14,190 Revenue USD Mil Gross Margin % Operating Income USD Mil Operating Margin % Net Income USD Mil 1,064 568 595 591 260 654 1,164 636 932 -931 -38 2.62 1.43 1.53 1.55 0.72 1.93 3.45 1.99 3.07 -3.32 -0.15 Earnings Per Share USD Dividends USD 0.25 0.25 0.25 0.25 0.25 0.25 0.25 0.25 0.25 0.25 0.25 8.1 17.5 12.8 21.6 14.1 45.5 8.7 6.3 13.7 Payout Ratio % * %* Shares Mil Book Value Per Share * USD 405 396 390 383 363 338 338 320 303 280 276 47.89 49.66 49.99 52.71 55.15 54.27 57.28 60.73 66.74 64.53 65.62 3,965 2,854 2,097 2,990 3,547 2,253 2,590 4,222 1,741 1,745 1,550 Operating Cash Flow USD Mil Cap Spending USD Mil Free Cash Flow USD Mil -857 -1,405 -1,737 -1,555 -1,450 -1,031 -995 -1,041 -710 -564 -2,753 237 3,108 1,449 360 1,992 803 1,559 3,227 700 1,035 986 0.81 3.66 0.93 2.17 1.80 4.98 3.99 9.67 3.54 3.07 Free Cash Flow Per Share * USD Working Capital USD Mil Key Ratios -> Profitability Margins % of Sales Revenue COGS 2011-12 2012-12 2013-12 2014-12 2015-12 2016-12 2017-12 2018-12 2019-12 2020-12 TTM 100.00 100.00 100.00 100.00 100.00 100.00 100.00 100.00 100.00 100.00 100.00 Gross Margin SG&A R&D 10.96 Other -10.96 Operating Margin Net Int Inc & Other 15.80 9.61 9.49 12.64 1.82 7.14 11.52 5.93 7.49 -10.71 0.45 EBT Margin 15.80 9.61 9.49 12.64 1.82 7.14 11.52 5.93 7.49 -10.71 0.45 TTM 28.13 -0.27 2011-12 2012-12 2013-12 2014-12 2015-12 2016-12 2017-12 2018-12 2019-12 2020-12 24.01 20.66 25.19 25.25 23.50 10.75 15.35 22.16 7.53 3.90 3.95 4.13 1.94 4.99 8.47 4.52 6.24 -6.81 0.19 0.19 0.19 0.18 0.17 0.17 0.18 0.18 0.18 0.17 1.40 0.73 0.74 0.75 0.34 0.86 1.49 0.81 1.16 -1.15 Profitability Tax Rate % Net Margin % Asset Turnover (Average) Return on Assets % Financial Leverage (Average) Return on Equity % Return on Invested Capital % Interest Coverage 0.18 -0.05 4.00 4.11 4.11 4.06 4.33 4.21 4.14 4.23 4.30 4.49 4.63 5.71 2.97 3.06 3.05 1.41 3.66 6.23 3.37 4.95 -5.04 -0.22 5.28 4.18 4.23 4.63 1.47 2.75 3.45 2.45 2.89 -1.84 1.13 Key Ratios -> Growth 2011-12 2012-12 2013-12 2014-12 2015-12 2016-12 2017-12 2018-12 2019-12 2020-12 Latest Qtr Revenue % Year over Year -3.34 3.01 3.44 -4.84 -6.35 -2.31 4.81 2.41 6.15 -8.47 16.88 2.17 1.02 0.99 0.47 -2.68 -4.51 -1.39 1.59 4.44 -0.17 0.37 -4.64 -4.56 2.59 0.29 -1.70 -1.49 -1.15 -1.35 0.83 -3.13 -1.83 -0.89 -0.62 -1.76 -3.08 -2.87 0.60 0.56 -0.67 3-Year Average 5-Year Average 10-Year Average Operating Income % Year over Year 3-Year Average 5-Year Average 10-Year Average Net Income % % Year over Year 3-Year Average 5-Year Average 10-Year Average -17.39 -46.62 4.75 -0.67 -56.01 151.54 77.98 -45.36 46.54 -38.30 0.24 -22.70 -17.80 -22.93 3.20 25.35 34.74 12.53 -15.65 -25.58 -33.37 0.94 -27.39 -9.27 15.43 1.34 9.54 -4.62 -7.08 -14.26 -12.52 -7.32 -17.83 5.15 EPS % - 14.33 -45.63 6.99 1.31 -53.55 168.06 78.76 -42.32 54.27 -144.09 Year over Year 3-Year Average 144.09 -33.76 3.23 -20.72 -16.16 -20.45 8.05 30.57 40.34 16.73 5-Year Average -6.85 -17.09 -29.92 3.58 -25.18 -6.00 19.26 5.40 14.65 10-Year Average 0.43 -1.91 -8.34 -6.43 -0.56 -14.06 8.97 2011-12 2012-12 2013-12 2014-12 2015-12 2016-12 2017-12 2018-12 2019-12 2020-12 TTM -28.02 -26.52 42.58 18.63 -36.48 14.96 63.01 -58.76 0.23 Key Ratios -> Cash Flow Cash Flow Ratios Operating Cash Flow Growth % YOY Free Cash Flow Growth % YOY Cap Ex as a % of Sales Free Cash Flow/Sales % -53.38 -75.16 -34.17 740.51 -59.69 94.15 106.99 -78.31 47.86 6.07 9.66 11.54 19.22 11.59 11.06 7.51 7.07 6.97 5.19 3.97 22.00 9.96 2.39 1.65 14.85 6.13 11.35 22.94 4.69 7.57 6.95 Free Cash Flow/Net Income 2.92 2.55 0.61 0.40 7.66 1.23 1.34 5.07 0.75 -1.11 -25.95 Key Ratios -> Financial Health Balance Sheet Items (in %) Cash & Short-Term Investments Accounts Receivable Inventory Other Current Assets Total Current Assets 2011-12 2012-12 2013-12 2014-12 2015-12 2016-12 2017-12 2018-12 2019-12 2020-12 Latest Qtr 6.94 60.82 60.41 60.16 58.97 60.04 58.56 55.95 57.33 62.01 60.65 12.28 11.16 11.15 9.39 10.04 9.44 9.05 9.66 8.85 9.29 10.67 -19.23 -71.98 -71.56 -69.55 -69.01 -69.48 -67.60 -65.61 -66.18 -71.30 -71.33 Net PP&E 18.07 17.41 18.14 19.92 20.36 19.88 19.38 19.81 18.93 13.03 12.40 1.20 1.24 0.45 0.48 0.46 0.45 1.63 1.72 1.74 0.44 Intangibles Other Long-Term Assets 1.63 -21.43 -19.27 -18.66 -18.58 -20.40 -20.82 -20.34 -21.01 -20.65 -14.76 -12.84 Total Assets 100.00 100.00 100.00 100.00 100.00 100.00 100.00 100.00 100.00 100.00 100.00 0.23 0.27 0.19 0.92 0.80 0.21 0.08 0.06 0.14 0.12 0.39 0.12 0.03 1.13 0.46 1.47 0.15 0.38 0.02 0.10 0.05 0.18 -0.35 -0.30 -1.32 -1.38 -2.27 -0.36 -0.46 -0.08 -0.23 -0.16 -0.57 Accounts Payable Short-Term Debt Taxes Payable Accrued Liabilities Other Short-Term Liabilities Total Current Liabilities Long-Term Debt Other Long-Term Liabilities Total Liabilities Total Stockholders' Equity Total Liabilities & Equity 12.56 12.29 13.43 14.16 13.48 14.94 15.16 15.06 14.42 12.76 11.43 -12.56 - 12.29 -13.43 -14.16 -13.48 -14.94 -15.16 -15.06 -14.42 -12.76 -11.43 73.45 73.99 73.88 73.59 75.19 74.56 74.13 75.46 75.93 77.37 78.07 26.55 26.01 26.12 26.41 24.81 25.44 25.87 22.63 21.93 24.54 24.07 100.00 100.00 100.00 100.00 100.00 100.00 100.00 100.00 100.00 100.00 100.00 2011-12 2012-12 2013-12 2014-12 2015-12 2016-12 2017-12 2018-12 2019-12 2020-12 Latest Qtr Liquidity/Financial Health Current Ratio Quick Ratio Financial Leverage Debt/Equity 4.00 4.11 4.11 4.06 4.33 4.21 4.14 4.23 4.30 4.49 4.63 0.47 0.47 0.51 0.54 0.54 0.59 0.58 0.61 0.60 0.56 0.52 2011-12 2012-12 2013-12 2014-12 2015-12 2016-12 2017-12 2018-12 2019-12 2020-12 TTM Key Ratios -> Efficiency Ratios Efficiency Days Sales Outstanding Days Inventory Payables Period Cash Conversion Cycle Receivables Turnover Inventory Turnover Fixed Assets Turnover Asset Turnover 1.08 1.06 1.06 0.95 0.86 0.85 0.90 0.91 0.96 1.05 1.15 0.19 0.19 0.19 0.18 0.17 0.17 0.18 0.18 0.18 0.17 0.18 Then, answer the following questions related to Home Depot. Once you have entered the information for the Home Depot, you'll have to repeat the above steps to answer the questions for "Lowe's Companies" as well. Then, answer the remaining question comparing the two companies. We will focus our attention on the Key Ratios for the year ended January 2019. Solvency Ratios reflect a companies ability Home Depot Lowes Which is better? to pay long-term debt Select an answer V Debt / Equity Ratio Select an answer Interest Coverage Ratio Select an answer HD Key Ratios Growth Profitability and Financial Ratios for The Home Depot Inc Financials 2012-01 2013-01 2014-01 2015-01 2016-01 2017-01 2018-01 2019-01 2020-01 2021-01 TTM Revenue USD Mil 70,395 74,754 78,812 83,176 88,519 94,595 100,904 108,203 110,225 132, 110 141,350 Gross Margin % 34.5 34.6 34.8 34.8 34.2 34.2 34.0 34.3 34.1 34.0 33.9 Operating Income USD Mil 6,661 7,766 9,166 10,469 11,774 13,427 14,681 15,777 15,843 18,278 20,783 Operating Margin % 9.5 10.4 11.6 12.6 13.3 14.2 14.5 14.6 14.4 13.8 14.7 Net Income USD Mil 3,883 4.535 5,385 6,345 7.009 7.957 8.630 11.121 11,242 12,866 14,766 Earnings Per Share USD 2.47 3.00 3.76 4.71 5.46 6.45 7.29 9.73 10.25 11.94 13.72 Dividends USD 1.04 1.16 1.56 1.8.8 2.36 2.76 3.56 4.12 5.44 6.00 6.15 Payout Ratio % 42.1 41.1 39.5 40.9 41.9 43.1 46.6 43.5 50.8 50.6 44.8 Shares Mil 1,570 1,511 1,434 1,346 1,283 1,234 1.184 1.143 1.097 1,078 1,078 Book Value Per Share * USD 11.64 11.86 10.09 7.67 6.09 4.67 2.20 1.17 -0.99 1.43 1.64 Operating Cash Flow USD Mil 6,651 6,975 7.628 8,242 9,373 9,783 12.031 13,038 13,723 18,839 19,412 Cap Spending USD Mil - 1,221 -1,312 -1,389 -1,442 -1,503 -1,621 -1,897 -2.442 -2,678 -2,463 -2,401 Free Cash Flow USD Mil 5,430 5,663 6,239 6,800 7,870 8.162 10,134 10,596 11.045 16,376 17.011 Free Cash Flow Per Share * USD 3.46 3.32 4.24 4.74 6.04 6.70 8.18 8.73 9.99 16.71 Working Capital USD Mil 5,144 3,910 4,530 4,033 4,467 3,591 2.739 1,813 1,435 5,311 Key Ratios -> Profitability Margins % of Sales % Revenue COGS 2012-01 2013-01 2014-01 2015-01 2016-01 2017-01 2018-01 2019-01 2020-01 2021-01 TTM 100.00 100.00 100.00 100.00 100.00 100.00 100.00 100.00 100.00 100.00 100.00 65.53 65.43 65.19 65.84 65.95 65.66 65.91 66.05 66.06 34.47 34.57 34.75 34.81 34.19 34.16 34.05 34.34 34.09 33.95 33.94 22.77 22.08 20.24 18.98 18.11 17.70 18.03 17.91 18.51 17.68 65.25 65.81 Gross Margin SG&A 21.06 R&D Other 2.23 2.10 2.06 1.98 1.91 1.85 1.79 1.73 1.80 1.61 1.55 9.46 10.39 11.63 12.59 13.30 14.19 14.55 14.58 14.37 13.84 14.70 Operating Margin Net Int Inc & Other & EBT Margin -0.84 -0.73 -0.89 -0.59 -0.85 -0.99 -0.97 -1.13 -1.02 -0.98 -0.94 8.62 9.66 10.74 11.99 12.45 13.20 13.58 13.45 13.35 12.85 13.77 Profitability Tax Rate % Net Margin % Asset Turnover (Average) Return on Assets % Financial Leverage (Average) 2012-01 2013-01 2014-01 2015-01 2016-01 2017-01 2018-01 2019-01 2020-01 2021-01 TTM 36.01 37.20 36.40 36.40 36.40 36.30 37.00 23.60 23.60 24.22 24.11 5.52 6.07 6.83 7.63 7.92 8.41 8.55 10.28 10.20 9.74 10.45 1.75 1.83 1.93 2.07 2.14 2.21 2.31 2.44 2.31 2.17 2.15 9.63 11.11 13.20 15.77 16.99 18.61 19.73 25.12 23.61 21.12 22.49 2.26 2.31 3.24 4.29 6.74 9.92 30.63 21.39 41.51 21.11 25.42 35.55 58.09 89.64 149.44 298.25 14.87 17.18 20.89 24.77 27.66 30.76 32.79 34.21 11.01 12.43 12.91 13.02 12.99 13.85 13.96 14.85 13.25 13.60 15.29 Return on Equity % Return on Invested Capital % Interest Coverage Key Ratios -> Growth -> 2012-01 2013-01 2014-01 2015-01 2016-01 2017-01 2018-01 2019-01 2020-01 2021-01 Latest Qtr Revenue % 3.53 6.19 5.43 5.54 6.42 6.86 6.67 7.23 1.87 19.85 32.70 Year over Year 3-Year Average - 5-Year Average -0.42 4.15 5.04 5.72 5.80 6.27 6.65 6.92 5.23 9.40 -4.97 -0.68 2.03 4.68 5.42 6.09 6.18 6.54 5.79 8.34 2.77 2.53 1.97 1.30 0.83 0.41 2.69 4.26 5.23 6.87 14.08 16.59 18.03 14.22 12.47 14.04 9.34 7.47 0.42 15.37 76.47 15.18 16.22 16.27 14.88 13.57 11.93 10.25 5.67 7.58 17.37 1.41 -7.19 16.03 16.86 15.06 15.05 13.58 11.47 8.64 9.19 3.05 2.91 2.96 2.82 2.32 3.33 7.32 13.73 12.68 12.09 16.33 16.79 18.74 17.83 10.46 13.53 8.46 28.86 1.09 14.45 10-Year Average Operating Income % Year over Year 3-Year Average 5-Year Average 5- 10-Year Average Net Income % Year over Year 3-Year Average 5-Year Average 10-Year Average EPS % Year over Year 3-Year Average 5-Year Average 10-Year Average 19.77 17.28 17.78 15.62 13.90 10.80 16.64 12.21 14.24 19.45 0.63 -7.59 18.96 18.98 15.99 15.43 13.73 15.61 12.12 12.92 14.44 2.46 2.16 2.27 2.41 1.84 3.28 6.98 17.27 15.50 22.89 21.46 25.33 25.27 15.92 13.02 33.47 5.34 16.49 85.58 18.13 19.71 22.61 24.09 23.22 24.01 22.09 15.67 21.24 16.70 17.88 -2.41 4.83 22.92 24.57 22.12 21.16 19.43 20.94 16.83 16.94 6.71 6.76 7.18 7.62 7.22 8.74 11.89 21.93 20.64 19.50 Key Ratios -> Cash Flow Cash Flow Ratios Operating Cash Flow Growth % YOY Free Cash Flow Growth % YOY Cap Ex as a % of Sales a Free Cash Flow/Sales % % Free Cash Flow/Net Income 2012-01 2013-01 2014-01 2015-01 2016-01 2017-01 2018-01 2019-01 2020-01 2021-01 TTM 45.06 4.87 9.36 8.05 13.72 4.37 22.98 8.37 5.25 37.28 55.63 4.29 10.17 8.99 15.74 3.71 24.16 4.56 4.24 48.27 1.73 1.76 1.76 1.73 1.70 1.71 1.88 2.26 2.43 1.86 1.70 7.71 7.58 7.92 8.18 8.89 8.63 10.04 9.79 12.40 12.03 10.02 1.40 1.25 1.16 1.07 1.12 1.03 1.17 0.95 0.98 1.27 1.15 2012-01 2013-01 2014-01 2015-01 2016-01 2017-01 2018-01 2019-01 2020-01 2021-01 Latest Qtr 4.90 6.07 4.76 4.31 5.21 5.91 8.07 4.04 4.16 11.19 9.16 3.07 3.40 3.45 3.72 4.44 4.72 4.38 4.40 4.11 4.24 4.99 25.48 26.07 27.29 27.73 27.75 29.21 28.63 31.65 28.36 23.56 26.43 2.38 1.88 2.21 2.54 2.53 1.42 1.43 2.02 2.03 1.36 1.68 35.84 37.42 37.71 38.31 39.94 41.25 42.52 42.11 38.66 40.35 42.27 60.34 58.58 57.62 56.88 52.15 51.00 49.57 50.85 55.36 43.45 42.08 2.76 2.85 3.18 3.39 4.94 4.87 5.11 5.12 4.40 10.10 9.84 1.06 1.15 1.49 1.43 2.97 2.87 2.80 1.92 1.58 6.11 5.82 100.00 100.00 100.00 100.00 100.00 100.00 100.00 100.00 100.00 100.00 100.00 Key Ratios -> Financial Health Balance Sheet Items (in %) Cash & Short-Term Investments Accounts Receivable Inventory Other Current Assets Total Current Assets Net PP&E Intangibles Other Long-Term Assets Total Assets Accounts Payable Short-Term Debt Taxes Payable Accrued Liabilities Other Short-Term Liabilities Total Current Liabilities Long-Term Debt Other Long-Term Liabilities Total Liabilities Total Stockholders' Equity Total Liabilities & Equity 11.98 13.09 14.31 14.54 15.43 16.29 16.27 17.62 15.20 16.44 19.97 0.07 3.22 0.08 0.82 1.00 2.91 6.20 5.44 5.49 2.01 1.60 1.02 1.20 1.01 1.17 1.20 1.24 1.29 1.52 1.29 1.37 1.58 3.84 7.30 7.83 8.00 8.13 8.56 8.56 9.36 8.14 7.83 9.28 6.22 3.09 3.30 3.67 3.68 3.88 4.05 4.05 5.75 5.17 5.81 23.14 27.90 26.53 28.21 29.44 32.89 36.37 37.99 35.86 32.82 38.25 26.55 23.06 36.26 42.23 49.09 52.02 54.50 60.92 55.96 50.75 47.81 6.14 5.77 6.31 6.22 6.63 5.01 5.87 5.36 14.26 11.75 11.53 55.83 89.92 96.73 104.27 106.08 95.33 97.59 56.73 69.10 76.66 85.16 43.27 30.90 23.34 14.84 100.00 100.00 100.00 100.00 44.17 100.00 2.41 10.08 100.00 3.27 -4.27 -6.08 4.67 100.00 100.00 100.00 100.00 100.00 2012-01 2013-01 2014-01 2015-01 2016-01 2017-01 2018-01 2019-01 2020-01 2021-01 Latest Qtr 1.36 1.08 1.55 1.34 1.42 1.36 1.25 1.17 1.11 1.23 1.10 Liquidity/Financial Health Current Ratio Quick Ratio Financial Leverage Debt/Equity 0.34 0.34 0.31 0.28 0.33 0.32 0.34 0.22 0.23 0.47 0.37 2.26 2.31 3.24 4.29 6.74 9.92 30.63 21.39 41.51 0.60 0.53 1.17 1.81 3.31 5.16 16.69 12.48 22.87 2012-01 2013-01 2014-01 2015-01 2016-01 2017-01 2018-01 2019-01 2020-01 2021-01 TTM 6.04 6.45 6.47 6.32 6.96 7.56 6.57 5.47 5.59 5.92 8.05 82.88 78.49 77.25 74.51 71.70 71.37 69.37 68.52 71.48 65.17 66.78 37.87 38.18 39.65 39.06 38.76 39.75 39.06 38.53 39.04 40.56 47.98 Key Ratios -> Efficiency Ratios Efficiency Days Sales Outstanding Days Inventory Payables Period Cash Conversion Cycle Receivables Turnover Inventory Turnover Fixed Assets Turnover Asset Turnover 51.05 46.75 44.07 41.77 39.90 39.19 36.88 35.46 38.03 30.53 26.84 60.42 56.63 56.44 57.72 52.47 48.28 55.55 66.71 65.26 61.62 45.35 4.40 4.65 4.72 4.90 5.09 5.11 5.26 5.32 5.11 5.60 5.47 2.84 3.08 3.32 3.61 3.94 4.29 4.59 4.87 4.34 4.48 4.80 1.75 1.83 1.93 2.07 2.14 2.21 2.31 2.44 2.31 2.17 2.15 L Key Ratios Growth Profitability and Financial Ratios for Loews Corp Financials 2011-12 2012-12 2013-12 2014-12 2015-12 2016-12 2017-12 2018-12 2019-12 2020-12 TTM 14,127 14,552 15,053 14,325 13,415 13,105 13,735 14,066 14,931 13,667 14,190 Revenue USD Mil Gross Margin % Operating Income USD Mil Operating Margin % Net Income USD Mil 1,064 568 595 591 260 654 1,164 636 932 -931 -38 2.62 1.43 1.53 1.55 0.72 1.93 3.45 1.99 3.07 -3.32 -0.15 Earnings Per Share USD Dividends USD 0.25 0.25 0.25 0.25 0.25 0.25 0.25 0.25 0.25 0.25 0.25 8.1 17.5 12.8 21.6 14.1 45.5 8.7 6.3 13.7 Payout Ratio % * %* Shares Mil Book Value Per Share * USD 405 396 390 383 363 338 338 320 303 280 276 47.89 49.66 49.99 52.71 55.15 54.27 57.28 60.73 66.74 64.53 65.62 3,965 2,854 2,097 2,990 3,547 2,253 2,590 4,222 1,741 1,745 1,550 Operating Cash Flow USD Mil Cap Spending USD Mil Free Cash Flow USD Mil -857 -1,405 -1,737 -1,555 -1,450 -1,031 -995 -1,041 -710 -564 -2,753 237 3,108 1,449 360 1,992 803 1,559 3,227 700 1,035 986 0.81 3.66 0.93 2.17 1.80 4.98 3.99 9.67 3.54 3.07 Free Cash Flow Per Share * USD Working Capital USD Mil Key Ratios -> Profitability Margins % of Sales Revenue COGS 2011-12 2012-12 2013-12 2014-12 2015-12 2016-12 2017-12 2018-12 2019-12 2020-12 TTM 100.00 100.00 100.00 100.00 100.00 100.00 100.00 100.00 100.00 100.00 100.00 Gross Margin SG&A R&D 10.96 Other -10.96 Operating Margin Net Int Inc & Other 15.80 9.61 9.49 12.64 1.82 7.14 11.52 5.93 7.49 -10.71 0.45 EBT Margin 15.80 9.61 9.49 12.64 1.82 7.14 11.52 5.93 7.49 -10.71 0.45 TTM 28.13 -0.27 2011-12 2012-12 2013-12 2014-12 2015-12 2016-12 2017-12 2018-12 2019-12 2020-12 24.01 20.66 25.19 25.25 23.50 10.75 15.35 22.16 7.53 3.90 3.95 4.13 1.94 4.99 8.47 4.52 6.24 -6.81 0.19 0.19 0.19 0.18 0.17 0.17 0.18 0.18 0.18 0.17 1.40 0.73 0.74 0.75 0.34 0.86 1.49 0.81 1.16 -1.15 Profitability Tax Rate % Net Margin % Asset Turnover (Average) Return on Assets % Financial Leverage (Average) Return on Equity % Return on Invested Capital % Interest Coverage 0.18 -0.05 4.00 4.11 4.11 4.06 4.33 4.21 4.14 4.23 4.30 4.49 4.63 5.71 2.97 3.06 3.05 1.41 3.66 6.23 3.37 4.95 -5.04 -0.22 5.28 4.18 4.23 4.63 1.47 2.75 3.45 2.45 2.89 -1.84 1.13 Key Ratios -> Growth 2011-12 2012-12 2013-12 2014-12 2015-12 2016-12 2017-12 2018-12 2019-12 2020-12 Latest Qtr Revenue % Year over Year -3.34 3.01 3.44 -4.84 -6.35 -2.31 4.81 2.41 6.15 -8.47 16.88 2.17 1.02 0.99 0.47 -2.68 -4.51 -1.39 1.59 4.44 -0.17 0.37 -4.64 -4.56 2.59 0.29 -1.70 -1.49 -1.15 -1.35 0.83 -3.13 -1.83 -0.89 -0.62 -1.76 -3.08 -2.87 0.60 0.56 -0.67 3-Year Average 5-Year Average 10-Year Average Operating Income % Year over Year 3-Year Average 5-Year Average 10-Year Average Net Income % % Year over Year 3-Year Average 5-Year Average 10-Year Average -17.39 -46.62 4.75 -0.67 -56.01 151.54 77.98 -45.36 46.54 -38.30 0.24 -22.70 -17.80 -22.93 3.20 25.35 34.74 12.53 -15.65 -25.58 -33.37 0.94 -27.39 -9.27 15.43 1.34 9.54 -4.62 -7.08 -14.26 -12.52 -7.32 -17.83 5.15 EPS % - 14.33 -45.63 6.99 1.31 -53.55 168.06 78.76 -42.32 54.27 -144.09 Year over Year 3-Year Average 144.09 -33.76 3.23 -20.72 -16.16 -20.45 8.05 30.57 40.34 16.73 5-Year Average -6.85 -17.09 -29.92 3.58 -25.18 -6.00 19.26 5.40 14.65 10-Year Average 0.43 -1.91 -8.34 -6.43 -0.56 -14.06 8.97 2011-12 2012-12 2013-12 2014-12 2015-12 2016-12 2017-12 2018-12 2019-12 2020-12 TTM -28.02 -26.52 42.58 18.63 -36.48 14.96 63.01 -58.76 0.23 Key Ratios -> Cash Flow Cash Flow Ratios Operating Cash Flow Growth % YOY Free Cash Flow Growth % YOY Cap Ex as a % of Sales Free Cash Flow/Sales % -53.38 -75.16 -34.17 740.51 -59.69 94.15 106.99 -78.31 47.86 6.07 9.66 11.54 19.22 11.59 11.06 7.51 7.07 6.97 5.19 3.97 22.00 9.96 2.39 1.65 14.85 6.13 11.35 22.94 4.69 7.57 6.95 Free Cash Flow/Net Income 2.92 2.55 0.61 0.40 7.66 1.23 1.34 5.07 0.75 -1.11 -25.95 Key Ratios -> Financial Health Balance Sheet Items (in %) Cash & Short-Term Investments Accounts Receivable Inventory Other Current Assets Total Current Assets 2011-12 2012-12 2013-12 2014-12 2015-12 2016-12 2017-12 2018-12 2019-12 2020-12 Latest Qtr 6.94 60.82 60.41 60.16 58.97 60.04 58.56 55.95 57.33 62.01 60.65 12.28 11.16 11.15 9.39 10.04 9.44 9.05 9.66 8.85 9.29 10.67 -19.23 -71.98 -71.56 -69.55 -69.01 -69.48 -67.60 -65.61 -66.18 -71.30 -71.33 Net PP&E 18.07 17.41 18.14 19.92 20.36 19.88 19.38 19.81 18.93 13.03 12.40 1.20 1.24 0.45 0.48 0.46 0.45 1.63 1.72 1.74 0.44 Intangibles Other Long-Term Assets 1.63 -21.43 -19.27 -18.66 -18.58 -20.40 -20.82 -20.34 -21.01 -20.65 -14.76 -12.84 Total Assets 100.00 100.00 100.00 100.00 100.00 100.00 100.00 100.00 100.00 100.00 100.00 0.23 0.27 0.19 0.92 0.80 0.21 0.08 0.06 0.14 0.12 0.39 0.12 0.03 1.13 0.46 1.47 0.15 0.38 0.02 0.10 0.05 0.18 -0.35 -0.30 -1.32 -1.38 -2.27 -0.36 -0.46 -0.08 -0.23 -0.16 -0.57 Accounts Payable Short-Term Debt Taxes Payable Accrued Liabilities Other Short-Term Liabilities Total Current Liabilities Long-Term Debt Other Long-Term Liabilities Total Liabilities Total Stockholders' Equity Total Liabilities & Equity 12.56 12.29 13.43 14.16 13.48 14.94 15.16 15.06 14.42 12.76 11.43 -12.56 - 12.29 -13.43 -14.16 -13.48 -14.94 -15.16 -15.06 -14.42 -12.76 -11.43 73.45 73.99 73.88 73.59 75.19 74.56 74.13 75.46 75.93 77.37 78.07 26.55 26.01 26.12 26.41 24.81 25.44 25.87 22.63 21.93 24.54 24.07 100.00 100.00 100.00 100.00 100.00 100.00 100.00 100.00 100.00 100.00 100.00 2011-12 2012-12 2013-12 2014-12 2015-12 2016-12 2017-12 2018-12 2019-12 2020-12 Latest Qtr Liquidity/Financial Health Current Ratio Quick Ratio Financial Leverage Debt/Equity 4.00 4.11 4.11 4.06 4.33 4.21 4.14 4.23 4.30 4.49 4.63 0.47 0.47 0.51 0.54 0.54 0.59 0.58 0.61 0.60 0.56 0.52 2011-12 2012-12 2013-12 2014-12 2015-12 2016-12 2017-12 2018-12 2019-12 2020-12 TTM Key Ratios -> Efficiency Ratios Efficiency Days Sales Outstanding Days Inventory Payables Period Cash Conversion Cycle Receivables Turnover Inventory Turnover Fixed Assets Turnover Asset Turnover 1.08 1.06 1.06 0.95 0.86 0.85 0.90 0.91 0.96 1.05 1.15 0.19 0.19 0.19 0.18 0.17 0.17 0.18 0.18 0.18 0.17 0.18