

Answered step by step
Verified Expert Solution
Question
1 Approved Answer
Debt-to-income ratio Loan Amount 35 127000 13 64845 18 87065 44 97000 47 37000 40 54189 11 80000 59 87500 21 253000 15 51000 30
| Debt-to-income ratio | Loan Amount |
| 35 | 127000 |
| 13 | 64845 |
| 18 | 87065 |
| 44 | 97000 |
| 47 | 37000 |
| 40 | 54189 |
| 11 | 80000 |
| 59 | 87500 |
| 21 | 253000 |
| 15 | 51000 |
| 30 | 165000 |
| 9 | 22853 |
| 17 | 188815 |
| 29 | 35000 |
| 38 | 34221 |
| 33 | 115000 |
| 30 | 77220 |
| 34 | 79000 |
| 42 | 73656 |
| 14 | 78000 |
| 14 | 56668 |
| 23 | 95920 |
| 21 | 55825 |
| 39 | 163240 |
| 17 | 81389 |
| 18 | 101300 |
| 21 | 122606 |
| 15 | 86339 |
| 16 | 183623 |
| 10 | 126412 |
| 23 | 44000 |
| 22 | 69832 |
| 43 | 157500 |
| 23 | 70000 |
| 24 | 77518 |
| 10 | 88792 |
| 35 | 57661 |
| 16 | 40590 |
| 22 | 73000 |
| 44 | 48048 |
| 34 | 111430 |
| 25 | 257477 |
| 17 | 105000 |
| 9 | 36000 |
| 15 | 145138 |
| 46 | 95000 |
| 31 | 117000 |
| 18 | 132792 |
| 12 | 45000 |
| 42 | 393400 |
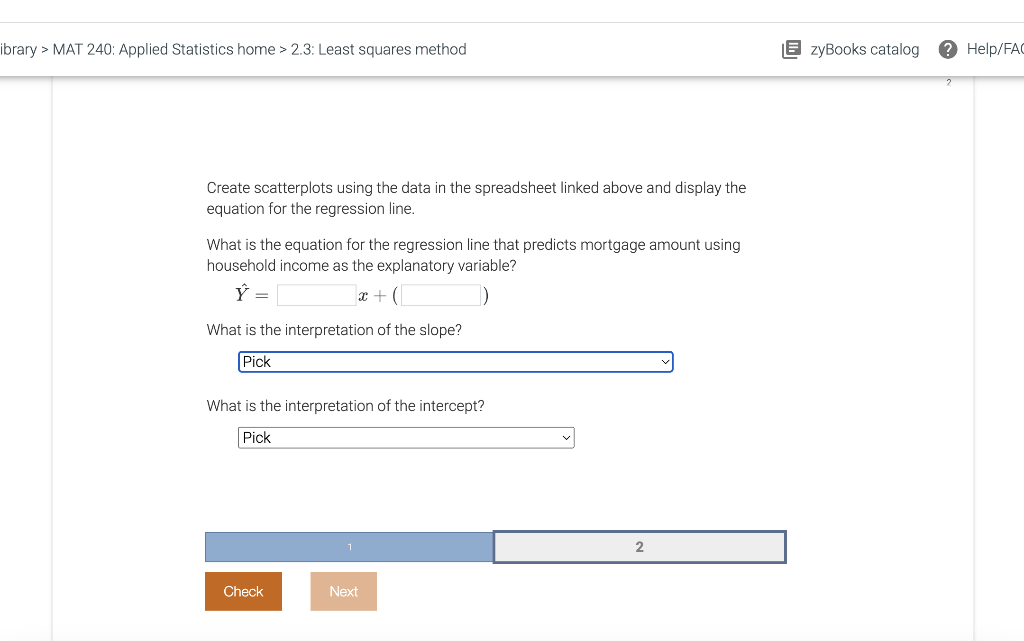
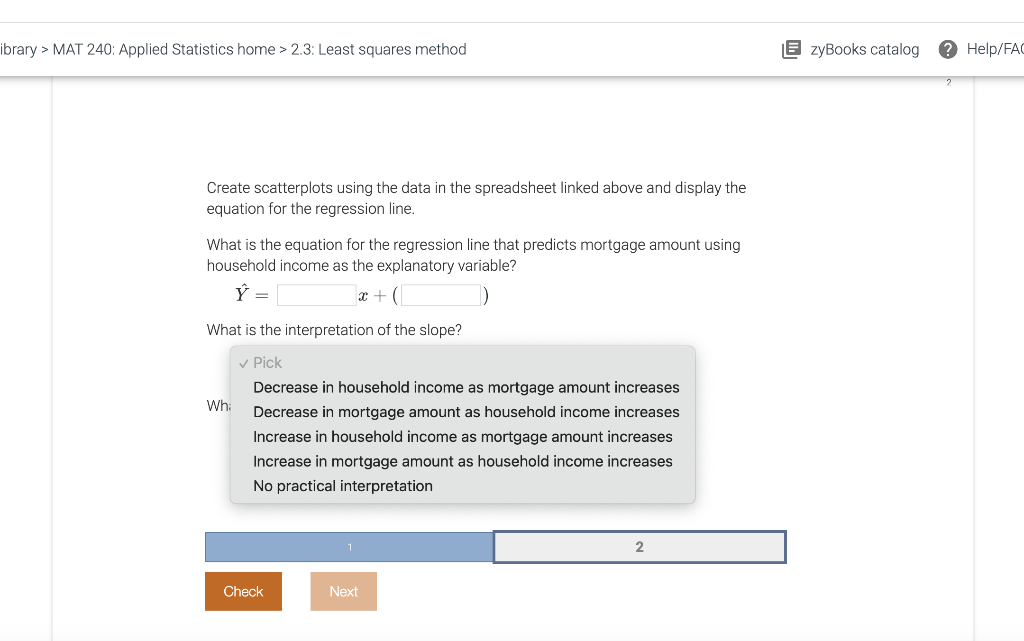
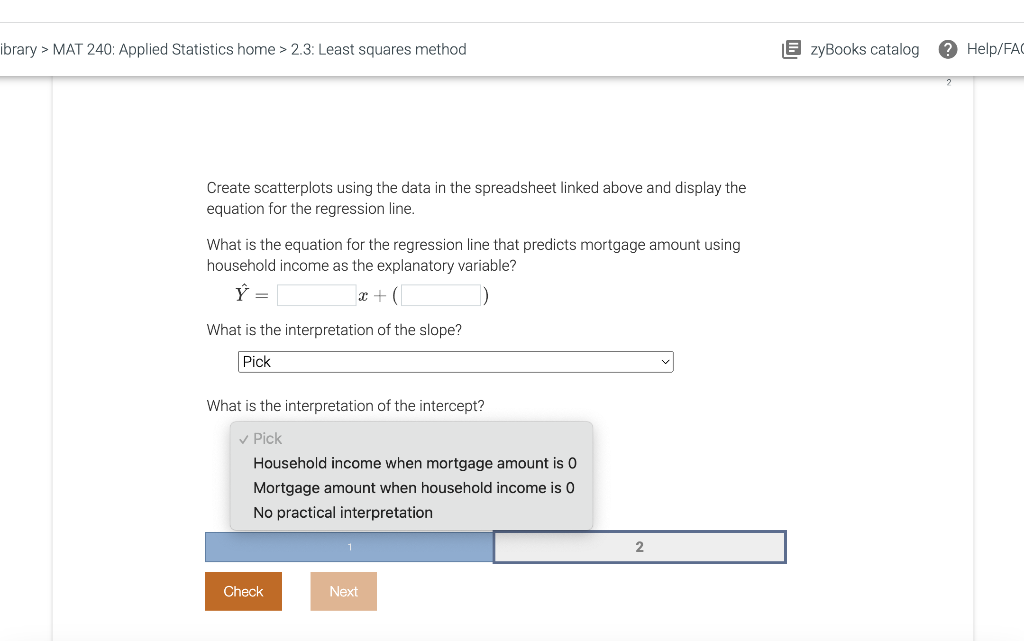
ibrary > MAT 240: Applied Statistics home > 2.3: Least squares method Create scatterplots using the data in the spreadsheet linked above and display the equation for the regression line. What is the equation for the regression line that predicts mortgage amount using household income as the explanatory variable? Y^=x+(1 What is the interpretation of the slope? What is the interpretation of the intercept? ibrary > MAT 240: Applied Statistics home > 2.3: Least squares method Create scatterplots using the data in the spreadsheet linked above and display the equation for the regression line. What is the equation for the regression line that predicts mortgage amount using household income as the explanatory variable? Y^=x+(1 What is the interpretation of the slope? Pick Decrease in household income as mortgage amount increases Decrease in mortgage amount as household income increases Increase in household income as mortgage amount increases Increase in mortgage amount as household income increases No practical interpretation ibrary > MAT 240: Applied Statistics home > 2.3: Least squares method Create scatterplots using the data in the spreadsheet linked above and display the equation for the regression line. What is the equation for the regression line that predicts mortgage amount using household income as the explanatory variable? Y^=x+(1 What is the interpretation of the slope? What is the interpretation of the intercept? Pick Household income when mortgage amount is 0 Mortgage amount when household income is 0 No practical interpretation
Step by Step Solution
There are 3 Steps involved in it
Step: 1

Get Instant Access to Expert-Tailored Solutions
See step-by-step solutions with expert insights and AI powered tools for academic success
Step: 2

Step: 3
Ace Your Homework with AI
Get the answers you need in no time with our AI-driven, step-by-step assistance
Get Started
Master Your Money Insider Secrets For Financial Success
Authors: William J. Ramirez
1st Edition
979-8865784432