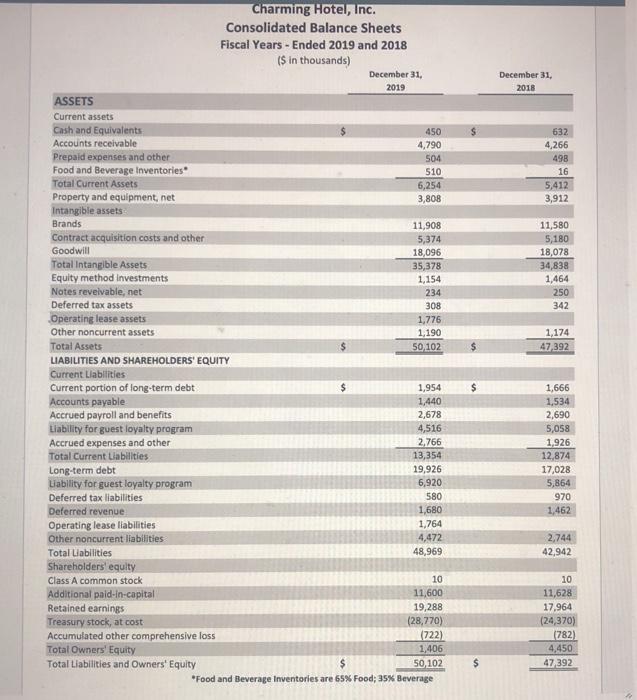
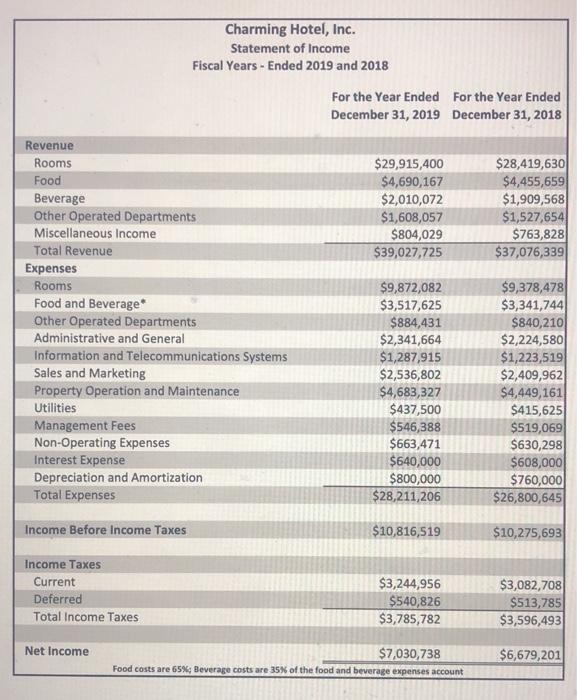
December 31, 2018 632 4,266 498 16 5,412 3,912 11,580 5,180 18,078 34,838 1,464 250 342 Charming Hotel, Inc. Consolidated Balance Sheets Fiscal Years - Ended 2019 and 2018 ($ in thousands) December 31, 2019 ASSETS Current assets Cash and Equivalents 450 Accounts receivable 4,790 Prepaid expenses and other 504 Food and Beverage Inventories 510 Total Current Assets 6,254 Property and equipment, net 3,808 Intangible assets Brands 11.908 Contract acquisition costs and other 5,374 Goodwill 18,096 Total Intangible Assets 35,378 Equity method investments 1,154 Notes revelvable, net 234 Deferred tax assets 308 Operating lease assets 1,776 Other noncurrent assets 1,190 Total Assets 50,102 LIABILITIES AND SHAREHOLDERS' EQUITY Current Liabilities Current portion of long-term debt 1,954 Accounts payable 1,440 Accrued payroll and benefits 2,678 Liability for guest loyalty program 4,516 Accrued expenses and other 2,766 Total Current Liabilities 13,354 Long-term debt 19,926 Liability for guest loyalty program 6,920 Deferred tax liabilities 580 Deferred revenue 1,680 Operating lease liabilities 1,764 Other noncurrent liabilities 4,472 Total Liabilities 48,969 Shareholders' equity Class A common stock 10 Additional paid-in-capital 11,600 Retained earnings 19,288 Treasury stock, at cost (28,770) Accumulated other comprehensive loss (722) Total Owners' Equity 1,406 Total Liabilities and Owners' Equity $ 50, 102 *Food and Beverage Inventories are 65% Food; 35% Beverage 1,174 47,392 $ 1,666 1.534 2,690 5,058 1.926 12,874 17,028 5,864 970 1,462 2,744 42,942 10 11,628 17,964 (24,370) (782) 4,450 47392 Charming Hotel, Inc. Statement of Income Fiscal Years - Ended 2019 and 2018 For the Year Ended for the Year Ended December 31, 2019 December 31, 2018 $29,915,400 $4,690,167 $2,010,072 $1,608,057 $804,029 $39,027,725 $28,419,630 $4,455,659 $1,909,568 $1,527,654 $763,828 $37,076,339 Revenue Rooms Food Beverage Other Operated Departments Miscellaneous Income Total Revenue Expenses Rooms Food and Beverage Other Operated Departments Administrative and General Information and Telecommunications Systems Sales and Marketing Property Operation and Maintenance Utilities Management Fees Non-Operating Expenses Interest Expense Depreciation and Amortization Total Expenses $9,872,082 $3,517,625 $884,431 $2,341,664 $1,287,915 $2,536,802 $4,683,327 $437,500 $546,388 $663,471 $640,000 $800,000 $28,211,206 $9,378,478 $3,341,744 $840,210 $2,224,580 $1,223,519 $2,409,962 $4,449,161 $415,625 $519,069 $630,298 $608,000 $760,000 $26,800,645 Income Before Income Taxes $10,816,519 $10,275,693 Income Taxes Current Deferred Total Income Taxes $3,244,956 $540,826 $3,785,782 $3,082,708 $513,785 $3,596,493 Net Income $7,030,738 Food costs are 65% Beverage costs are 35% of the food and beverage expenses account $6,679,201 Based on the attached Balance Sheet and Income Statement, please calculate the Accounts Receivable Turnover. Please show your answer to two digits. (i.e. 5.23)


