Answered step by step
Verified Expert Solution
Question
1 Approved Answer
Decision - Making Context: Understanding what happened in the past is an important first step in harnessing the power of business analytics. Descriptive analytics answers
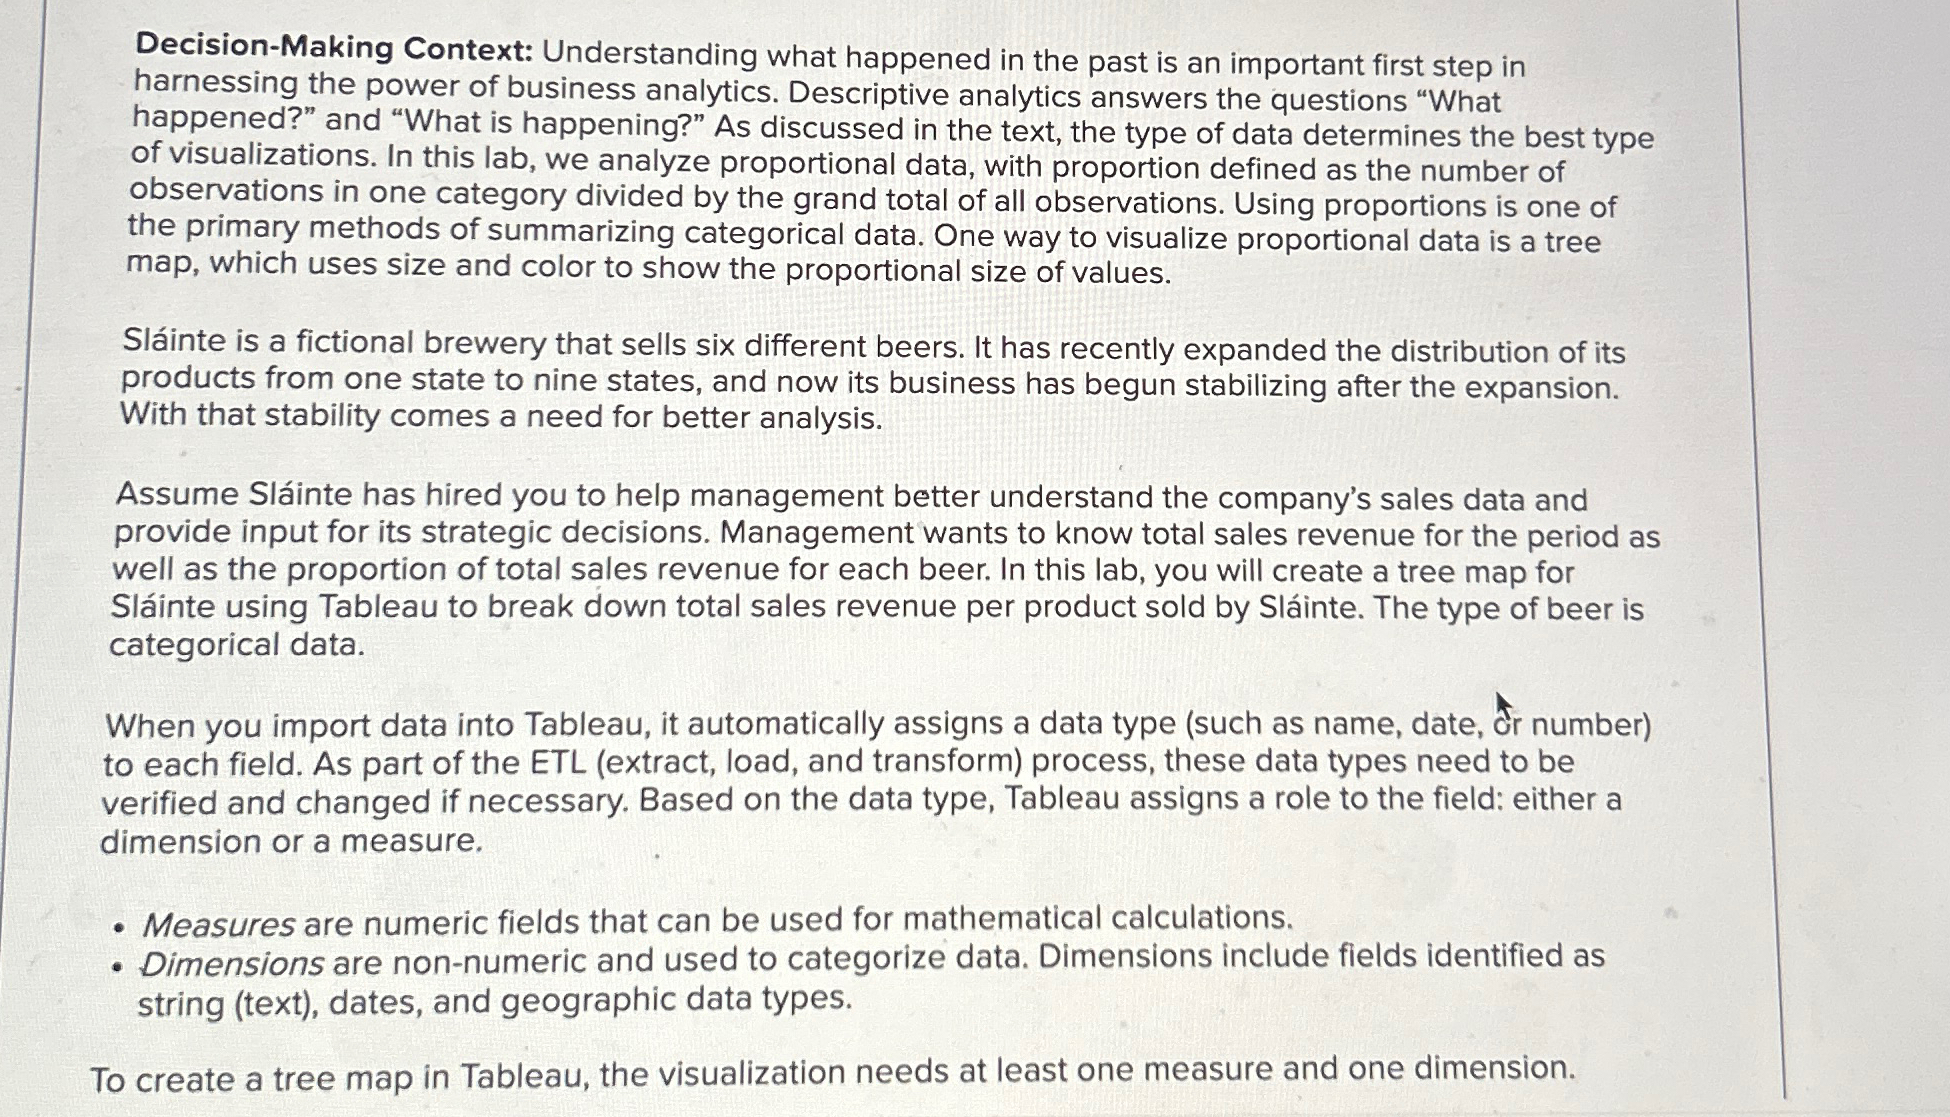
DecisionMaking Context: Understanding what happened in the past is an important first step in harnessing the power of business analytics. Descriptive analytics answers the questions "What happened?" and "What is happening?" As discussed in the text, the type of data determines the best type of visualizations. In this lab, we analyze proportional data, with proportion defined as the number of observations in one category divided by the grand total of all observations. Using proportions is one of the primary methods of summarizing categorical data. One way to visualize proportional data is a tree map, which uses size and color to show the proportional size of values.
Slinte is a fictional brewery that sells six different beers. It has recently expanded the distribution of its products from one state to nine states, and now its business has begun stabilizing after the expansion. With that stability comes a need for better analysis.
Assume Slinte has hired you to help management better understand the company's sales data and provide input for its strategic decisions. Management wants to know total sales revenue for the period as well as the proportion of total sales revenue for each beer. In this lab, you will create a tree map for Slinte using Tableau to break down total sales revenue per product sold by Slinte The type of beer is categorical data.
When you import data into Tableau, it automatically assigns a data type such as name, date, r number to each field. As part of the ETL extract load, and transform process, these data types need to be verified and changed if necessary. Based on the data type, Tableau assigns a role to the field: either a dimension or a measure.
Measures are numeric fields that can be used for mathematical calculations.
Dimensions are nonnumeric and used to categorize data. Dimensions include fields identified as string text dates, and geographic data types.
To create a tree map in Tableau, the visualization needs at least one measure and one dimension.

Step by Step Solution
There are 3 Steps involved in it
Step: 1

Get Instant Access to Expert-Tailored Solutions
See step-by-step solutions with expert insights and AI powered tools for academic success
Step: 2

Step: 3

Ace Your Homework with AI
Get the answers you need in no time with our AI-driven, step-by-step assistance
Get Started


