

Question
def getGrowth(population_year_zero, rate, immigration_per_year, nbr_of_years): # Set the first population which will be used in loop previous_population = population_year_zero # Initialize the result list new_population_list
def getGrowth(population_year_zero, rate, immigration_per_year, nbr_of_years): # Set the first population which will be used in loop previous_population = population_year_zero # Initialize the result list new_population_list = [] # We need to run the loop for 'nbr_of_years' times for i in range(nbr_of_years): # Find the new population from previous year poputlation new_population = (1+rate) * previous_population + immigration_per_year # Add the new population to the list new_population_list.append(new_population) # Assign the new population to previous population, to be used in next loop for next year previous_population = new_population # Return the filled list return new_population_list
The code up there was answered here (on chegg) and it's for the first part of the question (before Then on second photo) but I don't know how to relate this code to the second part of the question (after Then in the second photo). Because as you can see in the second photo we have to call the getGrowth function from the first part of the question (which is in a different python file) and plug its result into the graphGrowth function (in the current python file). But every time when I try to do this I get this error: 'function' object is not iterable
So python considers the result from getGrowth as a function and not as a list, so I can't do my calculations on it.
Can someone please help me with this.
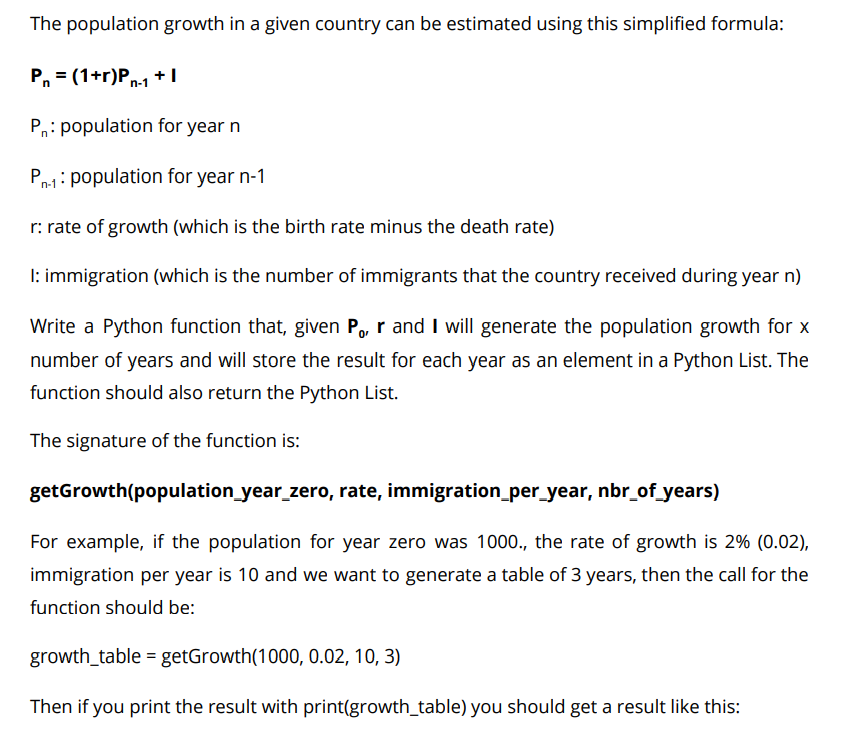
The population growth in a given country can be estimated using this simplified formula: Pn = (1+r)Pn-1 + 1 P.: population for year n Ph: population for year n-1 r: rate of growth (which is the birth rate minus the death rate) I: immigration (which is the number of immigrants that the country received during year n) Write a Python function that, given Po, r and I will generate the population growth for x number of years and will store the result for each year as an element in a Python List. The function should also return the Python List. The signature of the function is: getGrowth(population_year_zero, rate, immigration_per_year, nbr_of_years) For example, if the population for year zero was 1000., the rate of growth is 2% (0.02), immigration per year is 10 and we want to generate a table of 3 years, then the call for the function should be: growth_table = getGrowth(1000, 0.02, 10, 3) Then if you print the result with print(growth_table) you should get a result like this: [1030.0, 1060.6, 1091.812] which represents the list of the values for year 1, year 2 and year 3. Then Create a function that takes a list as an argument. The function uses the turtle module to graph the values from the list. For each element in the list you should graph a circle following these instructions: 1. For each element in the list, the index of the element represents its X coordinate. 2. The radius of the circle should be proportional to the value. The greater the value, the bigger the circle should be. Feel free to find a way to create a scaling factor that is reasonable and that makes the graph easy to view and to understand. Let's call the function graphGrowth and we'll be using it to graph the growth from the previous question (Question 1). The signature of the function is: graphGrowth(growth_list) For example, if we run the following: growth_table = getGrowth(1000, 0.02, 1000, 3) graphGrowth(growth_table) We should get something similar to the following graph: ( ) O oStep by Step Solution
There are 3 Steps involved in it
Step: 1

Get Instant Access to Expert-Tailored Solutions
See step-by-step solutions with expert insights and AI powered tools for academic success
Step: 2

Step: 3
Ace Your Homework with AI
Get the answers you need in no time with our AI-driven, step-by-step assistance
Get Started
SQL Server T-SQL Recipes
Authors: David Dye, Jason Brimhall
4th Edition
1484200616, 9781484200612