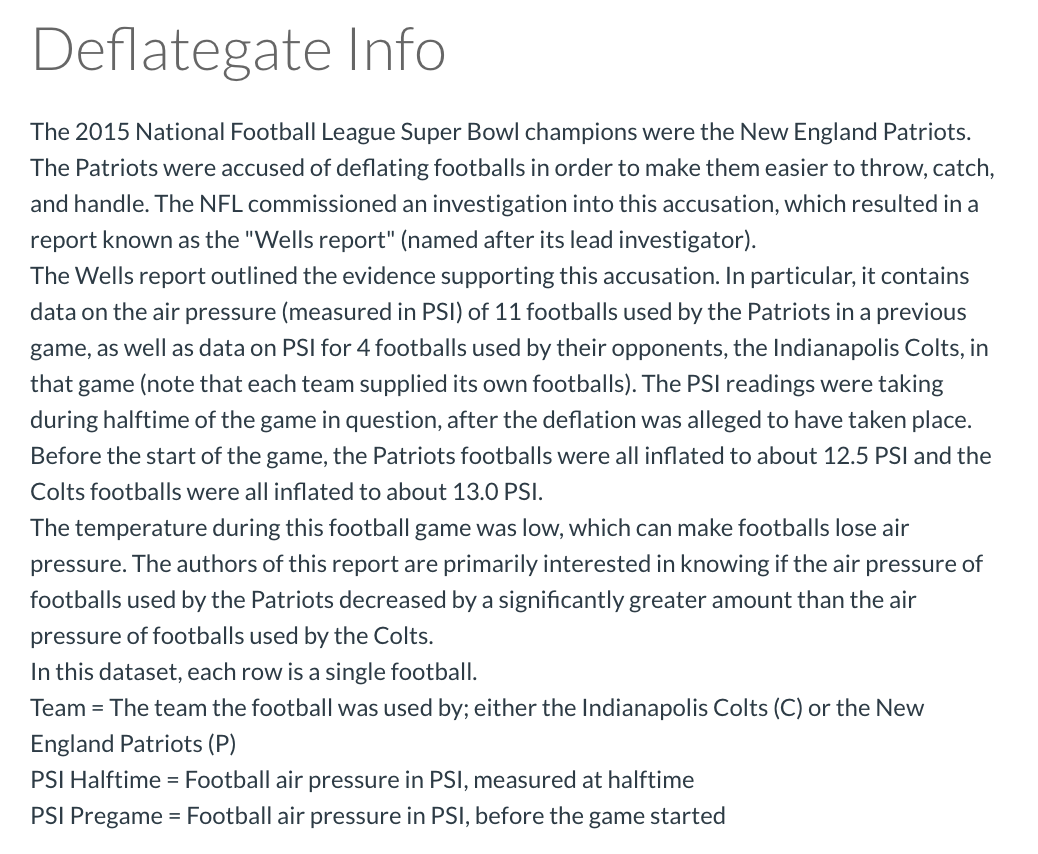
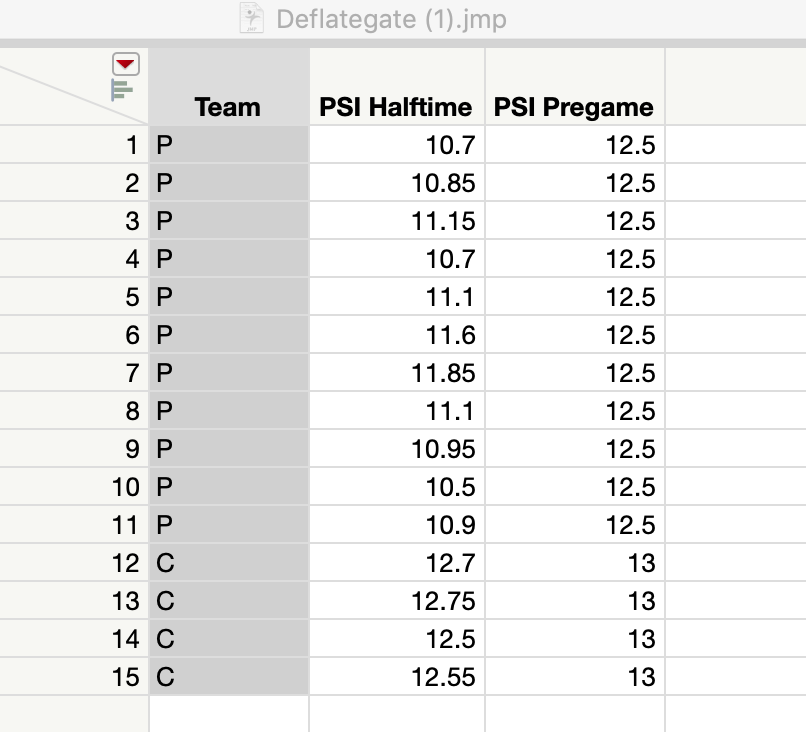
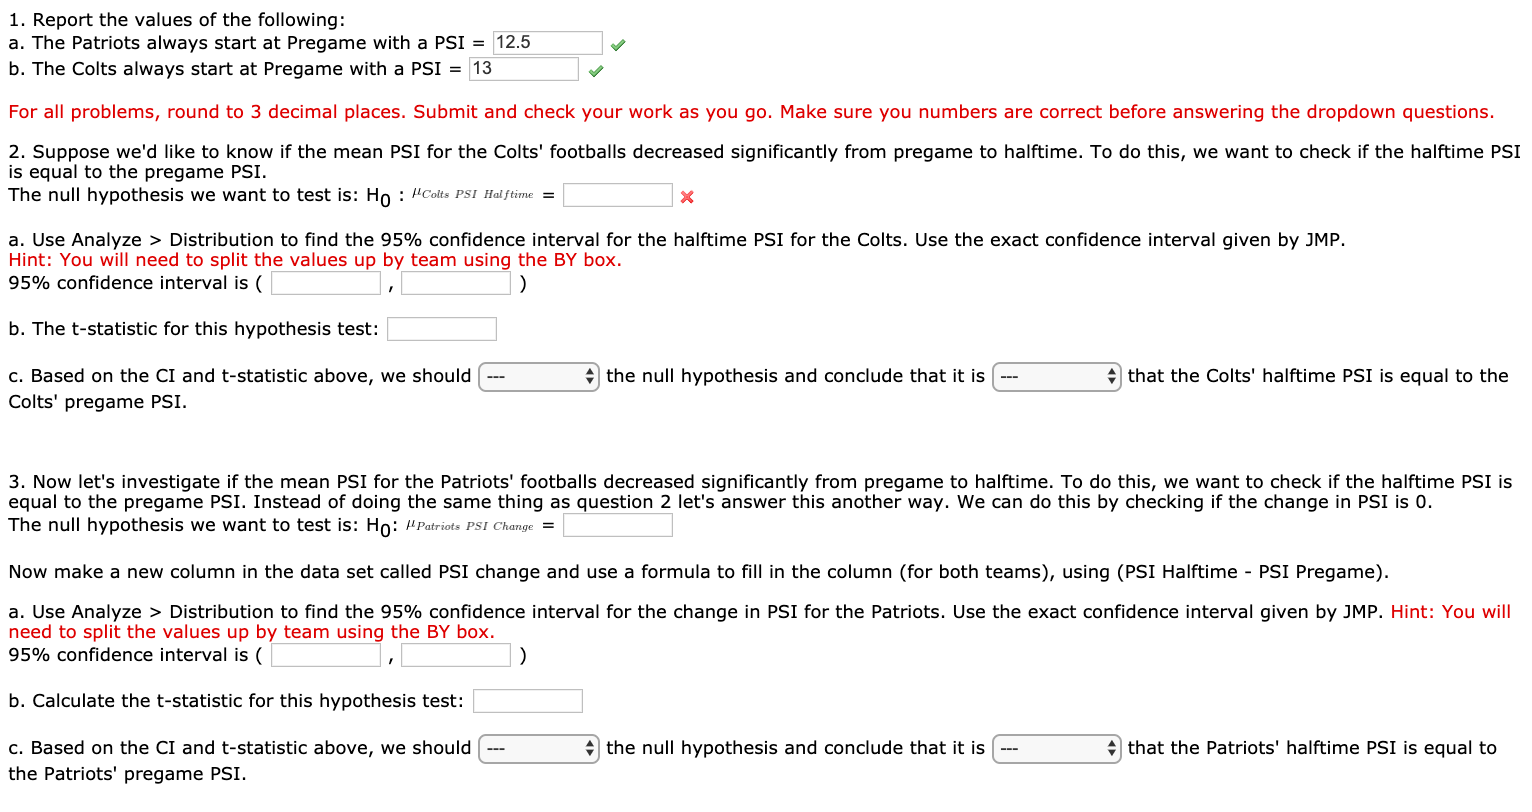
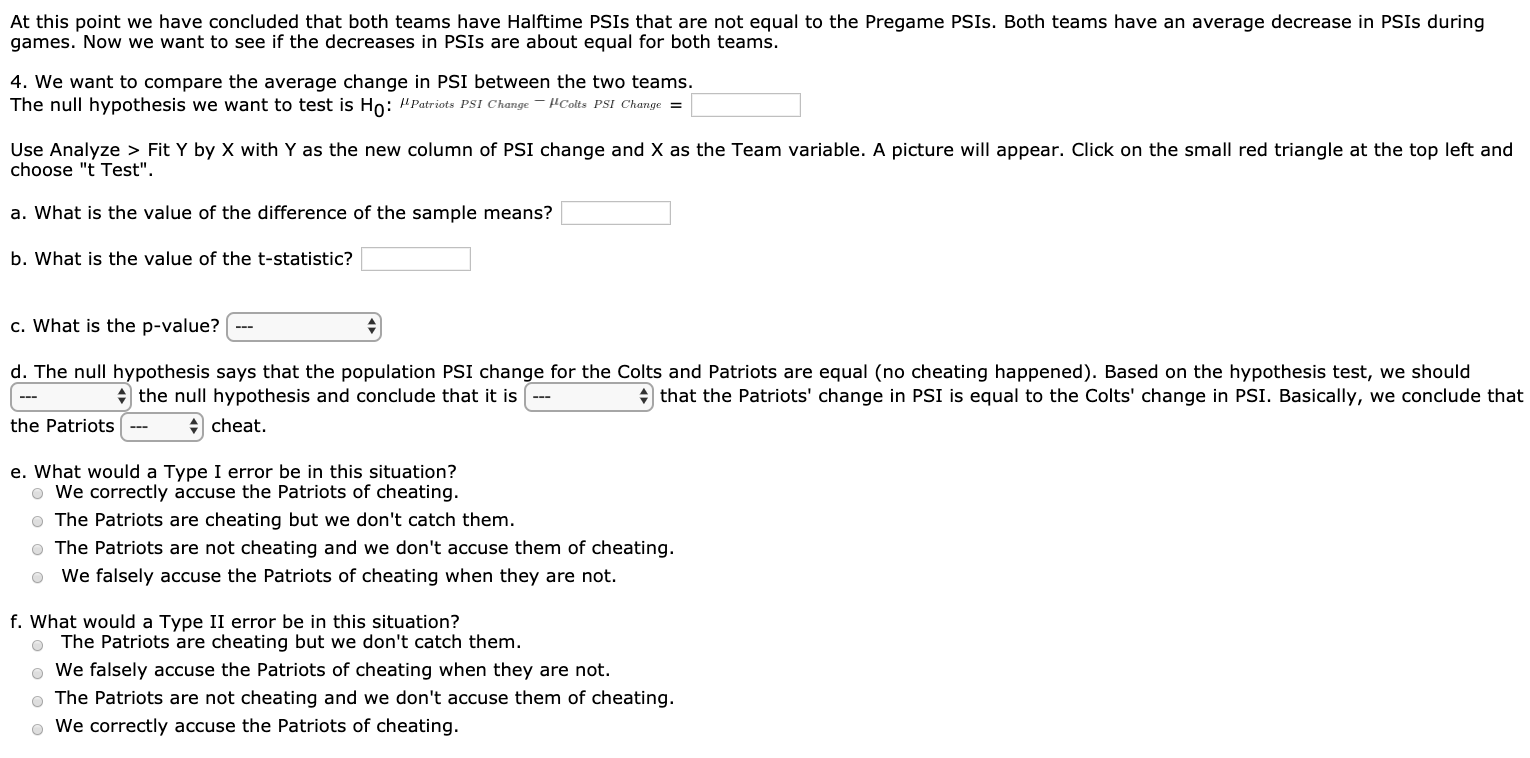
Deflategate Info The 2015 National Football League Super Bowl champions were the New England Patriots. The Patriots were accused of deflating footballs in order to make them easier to throw, catch, and handle. The NFL commissioned an investigation into this accusation, which resulted in a report known as the "Wells report" (named after its lead investigator). The Wells report outlined the evidence supporting this accusation. In particular, it contains data on the air pressure (measured in PSI) of 11 footballs used by the Patriots in a previous game, as well as data on PSI for 4 footballs used by their opponents, the Indianapolis Colts, in that game (note that each team supplied its own footballs). The PSI readings were taking during halftime of the game in question, after the deflation was alleged to have taken place. Before the start of the game, the Patriots footballs were all inflated to about 12.5 PSI and the Colts footballs were all inflated to about 13.0 PSI, The temperature during this football game was low, which can make footballs lose air pressure. The authors of this report are primarily interested in knowing if the air pressure of footballs used by the Patriots decreased by a significantly greater amount than the air pressure of footballs used by the Colts. In this dataset, each row is a single football. Team = The team the football was used by; either the Indianapolis Colts (C) or the New England Patriots (P) PSI Halftime = Football air pressure in PSI, measured at halftime PSI Pregame = Football air pressure in PSI, before the game started Deflategate (1).jmp Team 1 P 2 P PSI Halftime PSI Pregame 10.7 12.5 10.85 12.5 3 P 11.15 12.5 4 P 10.7 11.1 5 P 6 P 12.5 12.5 12.5 11.6 11.85 7 P 12.5 8P 9 P 10 P 11 P 12 C 13 C 11.1 10.95 10.5 10.9 12.7 12.5 12.5 12.5 12.5 13 12.75 13 14 C 13 12.5 12.55 15 C 13 1. Report the values of the following: a. The Patriots always start at Pregame with a PSI = 12.5 b. The Colts always start at Pregame with a PSI = 13 For all problems, round to 3 decimal places. Submit and check your work as you go. Make sure you numbers are correct before answering the dropdown questions. 2. Suppose we'd like to know if the mean PSI for the Colts' footballs decreased significantly from pregame to halftime. To do this, we want to check if the halftime PSI is equal to the pregame PSI. The null hypothesis we want to test is: Ho : 'Colts PSI Halftime = x a. Use Analyze > Distribution to find the 95% confidence interval for the halftime PSI for the Colts. Use the exact confidence interval given by JMP. Hint: You will need to split the values up by team using the BY box. 95% confidence interval is b. The t-statistic for this hypothesis test: c. Based on the CI and t-statistic above, we should Colts' pregame PSI. the null hypothesis and conclude that it is that the Colts' halftime PSI is equal to the 3. Now let's investigate if the mean PSI for the Patriots' footballs decreased significantly from pregame to halftime. To do this, we want to check if the halftime PSI is equal to the pregame PSI. Instead of doing the same thing as question 2 let's answer this another way. We can do this by checking if the change in PSI is 0. The null hypothesis we want to test is: Ho: Patriots PSI Change = Now make a new column in the data set called PSI change and use a formula to fill in the column (for both teams), using (PSI Halftime - PSI Pregame). a. Use Analyze > Distribution to find the 95% confidence interval for the change in PSI for the Patriots. Use the exact confidence interval given by JMP. Hint: You will need to split the values up by team using the BY box. 95% confidence interval is b. Calculate the t-statistic for this hypothesis test: c. Based on the CI and t-statistic above, we should the Patriots' pregame PSI. the null hypothesis and conclude that it is that the Patriots' halftime PSI is equal to At this point we have concluded that both teams have Halftime PSIs that are not equal to the Pregame PSIs. Both teams have an average decrease in PSIS during games. Now we want to see if the decreases in PSIS are about equal for both teams. 4. We want to compare the average change in PSI between the two teams. The null hypothesis we want to test is Ho: Patriots PSI Change - Colts PSI Change = Use Analyze > Fit Y by X with Y as the new column of PSI change and X as the Team variable. A picture will appear. Click on the small red triangle at the top left and choose " Test". a. What is the value of the difference of the sample means? b. What is the value of the t-statistic? c. What is the p-value? d. The null hypothesis says that the population PSI change for the Colts and Patriots are equal (no cheating happened). Based on the hypothesis test, we should the null hypothesis and conclude that it is that the Patriots' change in PSI is equal to the Colts' change in PSI. Basically, we conclude that the Patriots cheat. e. What would a Type I error be in this situation? . We correctly accuse the Patriots of cheating. o The Patriots are cheating but we don't catch them. o The Patriots are not cheating and we don't accuse them of cheating. We falsely accuse the Patriots of cheating when they are not. O O f. What would a Type II error be in this situation? The Patriots are cheating but we don't catch them. . We falsely accuse the Patriots of cheating when they are not. The Patriots are not cheating and we don't accuse them of cheating. We correctly accuse the Patriots of cheating. Deflategate Info The 2015 National Football League Super Bowl champions were the New England Patriots. The Patriots were accused of deflating footballs in order to make them easier to throw, catch, and handle. The NFL commissioned an investigation into this accusation, which resulted in a report known as the "Wells report" (named after its lead investigator). The Wells report outlined the evidence supporting this accusation. In particular, it contains data on the air pressure (measured in PSI) of 11 footballs used by the Patriots in a previous game, as well as data on PSI for 4 footballs used by their opponents, the Indianapolis Colts, in that game (note that each team supplied its own footballs). The PSI readings were taking during halftime of the game in question, after the deflation was alleged to have taken place. Before the start of the game, the Patriots footballs were all inflated to about 12.5 PSI and the Colts footballs were all inflated to about 13.0 PSI, The temperature during this football game was low, which can make footballs lose air pressure. The authors of this report are primarily interested in knowing if the air pressure of footballs used by the Patriots decreased by a significantly greater amount than the air pressure of footballs used by the Colts. In this dataset, each row is a single football. Team = The team the football was used by; either the Indianapolis Colts (C) or the New England Patriots (P) PSI Halftime = Football air pressure in PSI, measured at halftime PSI Pregame = Football air pressure in PSI, before the game started Deflategate (1).jmp Team 1 P 2 P PSI Halftime PSI Pregame 10.7 12.5 10.85 12.5 3 P 11.15 12.5 4 P 10.7 11.1 5 P 6 P 12.5 12.5 12.5 11.6 11.85 7 P 12.5 8P 9 P 10 P 11 P 12 C 13 C 11.1 10.95 10.5 10.9 12.7 12.5 12.5 12.5 12.5 13 12.75 13 14 C 13 12.5 12.55 15 C 13 1. Report the values of the following: a. The Patriots always start at Pregame with a PSI = 12.5 b. The Colts always start at Pregame with a PSI = 13 For all problems, round to 3 decimal places. Submit and check your work as you go. Make sure you numbers are correct before answering the dropdown questions. 2. Suppose we'd like to know if the mean PSI for the Colts' footballs decreased significantly from pregame to halftime. To do this, we want to check if the halftime PSI is equal to the pregame PSI. The null hypothesis we want to test is: Ho : 'Colts PSI Halftime = x a. Use Analyze > Distribution to find the 95% confidence interval for the halftime PSI for the Colts. Use the exact confidence interval given by JMP. Hint: You will need to split the values up by team using the BY box. 95% confidence interval is b. The t-statistic for this hypothesis test: c. Based on the CI and t-statistic above, we should Colts' pregame PSI. the null hypothesis and conclude that it is that the Colts' halftime PSI is equal to the 3. Now let's investigate if the mean PSI for the Patriots' footballs decreased significantly from pregame to halftime. To do this, we want to check if the halftime PSI is equal to the pregame PSI. Instead of doing the same thing as question 2 let's answer this another way. We can do this by checking if the change in PSI is 0. The null hypothesis we want to test is: Ho: Patriots PSI Change = Now make a new column in the data set called PSI change and use a formula to fill in the column (for both teams), using (PSI Halftime - PSI Pregame). a. Use Analyze > Distribution to find the 95% confidence interval for the change in PSI for the Patriots. Use the exact confidence interval given by JMP. Hint: You will need to split the values up by team using the BY box. 95% confidence interval is b. Calculate the t-statistic for this hypothesis test: c. Based on the CI and t-statistic above, we should the Patriots' pregame PSI. the null hypothesis and conclude that it is that the Patriots' halftime PSI is equal to At this point we have concluded that both teams have Halftime PSIs that are not equal to the Pregame PSIs. Both teams have an average decrease in PSIS during games. Now we want to see if the decreases in PSIS are about equal for both teams. 4. We want to compare the average change in PSI between the two teams. The null hypothesis we want to test is Ho: Patriots PSI Change - Colts PSI Change = Use Analyze > Fit Y by X with Y as the new column of PSI change and X as the Team variable. A picture will appear. Click on the small red triangle at the top left and choose " Test". a. What is the value of the difference of the sample means? b. What is the value of the t-statistic? c. What is the p-value? d. The null hypothesis says that the population PSI change for the Colts and Patriots are equal (no cheating happened). Based on the hypothesis test, we should the null hypothesis and conclude that it is that the Patriots' change in PSI is equal to the Colts' change in PSI. Basically, we conclude that the Patriots cheat. e. What would a Type I error be in this situation? . We correctly accuse the Patriots of cheating. o The Patriots are cheating but we don't catch them. o The Patriots are not cheating and we don't accuse them of cheating. We falsely accuse the Patriots of cheating when they are not. O O f. What would a Type II error be in this situation? The Patriots are cheating but we don't catch them. . We falsely accuse the Patriots of cheating when they are not. The Patriots are not cheating and we don't accuse them of cheating. We correctly accuse the Patriots of cheating