Degree of school engagement and exposure to gangs are ratio. They both have true zero points. Remember to report the measure of central tendency (i.e.
Degree of school engagement and exposure to gangs are ratio. They both have true zero points. Remember to report the measure of central tendency (i.e. mean, median, or mode) for your variables. Please resubmit after you have reviewed all resources.
The first page is an example of how the answers should be displayed
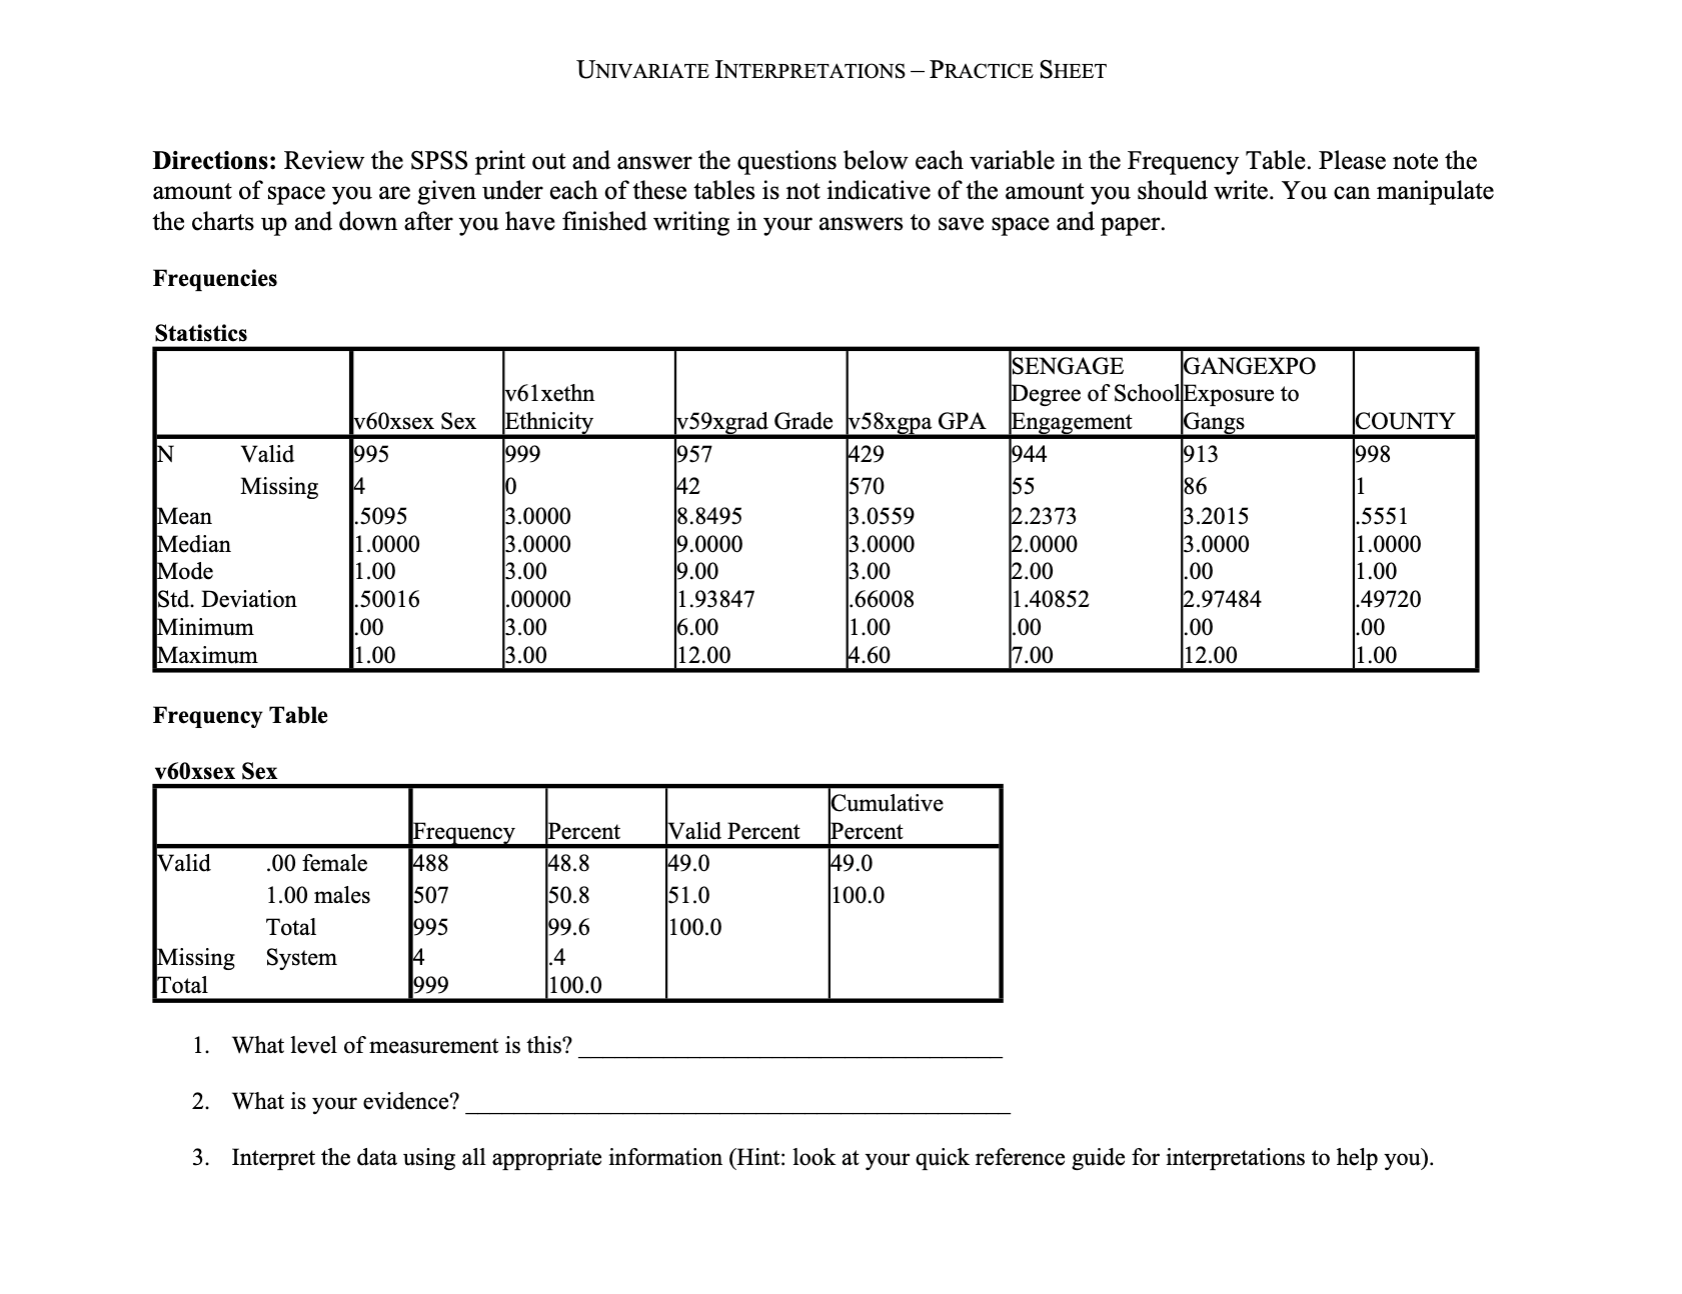
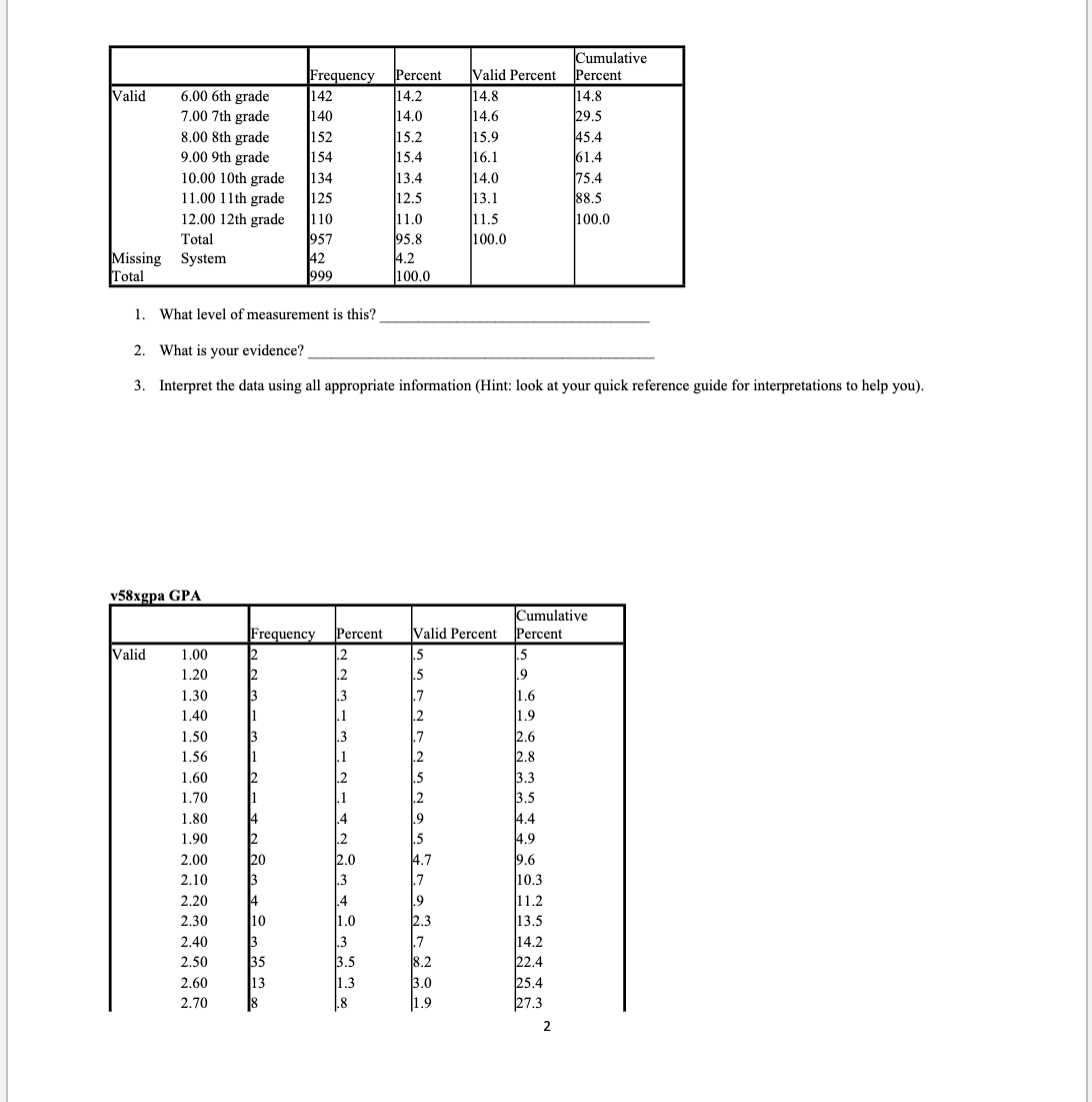
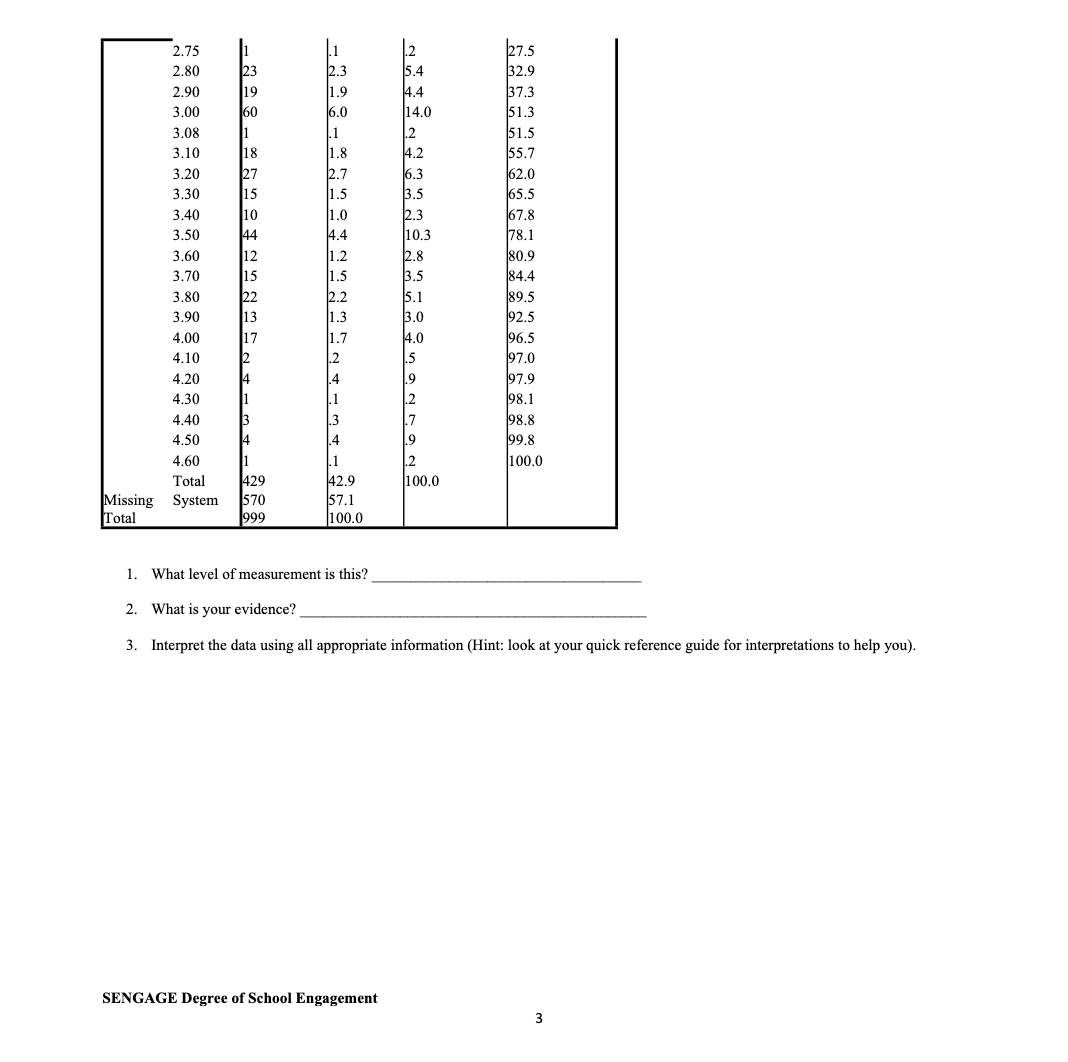
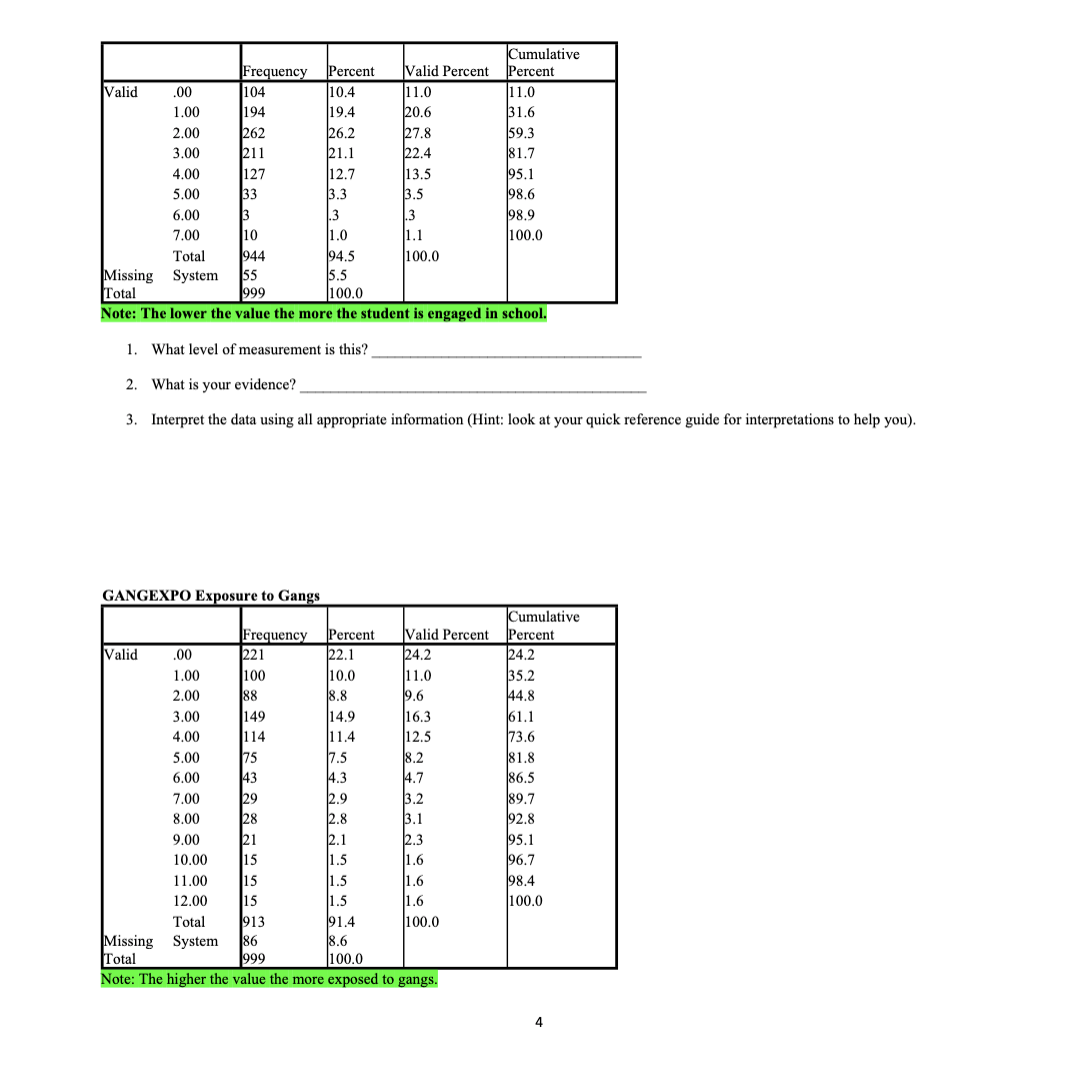
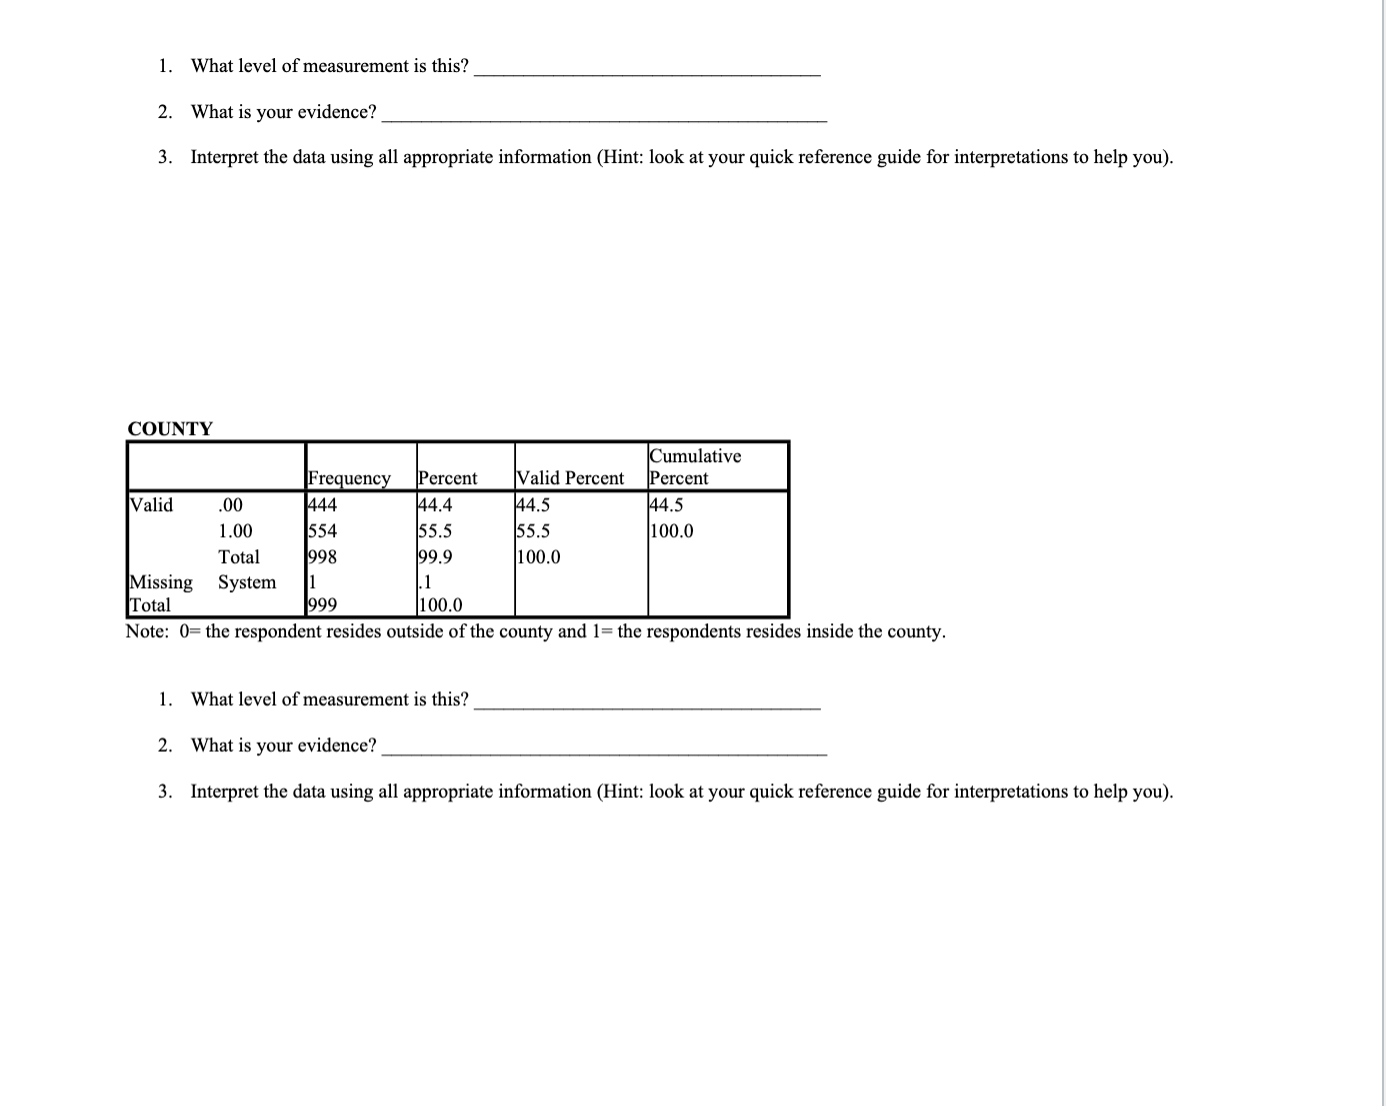
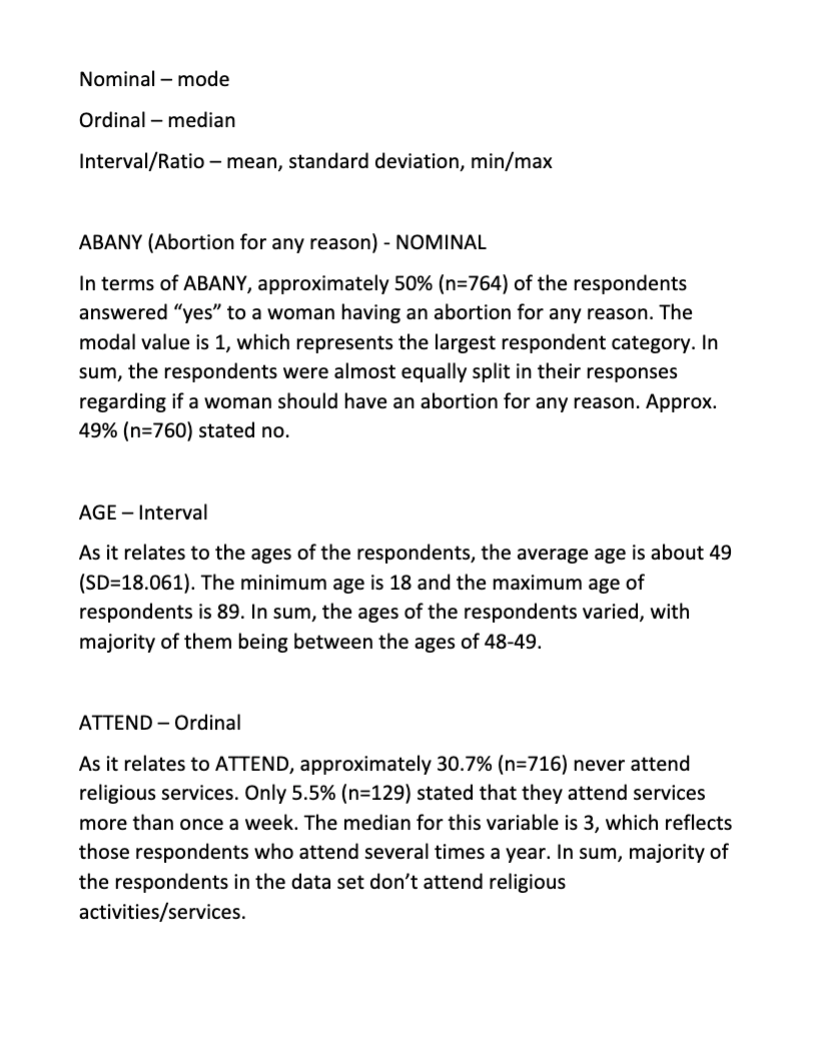
UNIVARIATE INTERPRETATIONS - PRACTICE SHEET Directions: Review the SPSS print out and answer the questions below each variable in the Frequency Table. Please note the amount of space you are given under each of these tables is not indicative of the amount you should write. You can manipulate the charts up and down after you have finished writing in your answers to save space and paper. Frequencies Statistics SENGAGE GANGEXPO 61xethn Degree of School Exposure to v60xsex Sex Ethnicity v59xgrad Grade v58xgpa GPA Engagement Gangs COUNTY N Valid 995 299 957 429 944 913 1998 Missing 12 570 55 186 Mean 5095 3.0000 8.8495 3.0559 2.2373 3.2015 5551 Median .0000 3.0000 9.0000 3.0000 2.0000 3.0000 1.0000 Mode ..00 3.00 9.00 3.00 2.00 1.00 Std. Deviation 50016 .00000 1.93847 66008 1.40852 2.97484 49720 Minimum 00 3.00 5.00 1.0 00 00 Maximum 1.00 3.00 12.00 4.60 7.00 12.00 1.00 Frequency Table v60xsex Sex Cumulative Frequency Percent Valid Percent Percent Valid 00 female 188 8. 49.0 49.0 1.00 males 507 50. 51.0 100.0 Tota 995 99.6 100.0 Missing System 4 4 Total 1999 100.0 1. What level of measurement is this? 2. What is your evidence? 3. Interpret the data using all appropriate information (Hint: look at your quick reference guide for interpretations to help you).Cumulative Frequency Percent Valid Percent Percent IValid 6.00 6th grade 142 14.2 14.8 14.8 7.00 7th grade 140 4.0 14.6 29.5 8.00 8th grade 52 15.2 15.9 145.4 9.00 9th grade 54 15.4 16.1 61.4 10.00 10th grade 134 13.4 14.0 75.4 11.00 11th grade 125 2.5 13.1 88.5 12.00 12th grade 110 11.0 11.5 100.0 Total 957 95.8 100.0 Missing System 42 4.2 Total 1999 00.0 What level of measurement is this? 2. What is your evidence? 3. Interpret the data using all appropriate information (Hint: look at your quick reference guide for interpretations to help you). v58xgpa GPA Cumulative Frequency Percent Valid Percent Percent Valid 1.00 1.20 1.30 1.40 1.50 1.56 .60 1.70 1.80 DO TY WE AWP NA- NEW- WNN 90 2.00 2.10 ..20 .30 .40 2.5 2.60 2.702.75 2.80 2.90 3.00 3.08 3.10 3.20 330 3.40 3.50 3.60 3.70 3.80 3.90 4.00 4.10 4.20 430 4.40 4.50 4.60 Total System ER A T R R R R 2 o 1. What level of measurement is this? 2. What is your evidence? 3. Interpret the data using all appropriate information (Hint: look at your quick reference guide for interpretations to help you). SENGAGE Degree of School Engagement Cumulative Frequency Percent Valid Percent Percent Valid 00 104 10.4 1.0 11.0 1.00 194 19.4 20.6 31.6 2.00 262 26.2 27.8 59.3 3.00 211 21.1 22.4 81.7 4.00 127 12.7 13.5 95.1 5.00 33 3.3 3.5 98.6 6.00 .3 98 9 7.00 10 1.0 1. 1 100.0 Total 944 194.5 100.0 Missing System 55 5.5 Total 1999 100.0 Note: The lower the value the more the student is engaged in school 1. What level of measurement is this? 2. What is your evidence? 3. Interpret the data using all appropriate information (Hint: look at your quick reference guide for interpretations to help you) GANGEXPO Exposure to Gangs Cumulative Frequency Percent Valid Percent Percent Valid 00 221 22.1 24.2 24.2 1.00 100 .0.0 1.0 35.2 2.00 38 8.8 9.6 44.8 3.00 149 14.9 16.3 61.1 4,00 114 11.4 12.5 73.6 5.00 7.5 8.2 81.8 6.00 4.3 4.7 86.5 7.00 2.9 3.2 89.7 8.00 2.8 3.1 92.8 9,00 2.1 2.3 95.1 10.00 1.5 1.6 96.7 11.00 1.5 1.6 98.4 12.00 1.5 100.0 Total 13 91.4 100.0 Missing System 86 8.6 Total 100.0 Note: The higher the value the more exposed to gangs.1. What level of measurement is this? 2. What is your evidence? 3. Interpret the data using all appropriate information (Hint: look at your quick reference guide for interpretations to help you). COUNTY Cumulative requenc Percent Valid Percent [Percent Note: 0= the respondent resides outside of the county and 1= the respondents resides inside the county. 1. What level of measurement is this? 2. What is your evidence? 3. Interpret the data using all appropriate information (Hint: look at your quick reference guide for interpretations to help you). Nominal mode Ordinal median Interval/Ratio mean, standard deviation, min/max ABANY (Abortion for any reason) - NOMINAL In terms of ABANY, approximately 50% (n=764) of the respondents answered \"yes\" to a woman having an abortion for any reason. The modal value is 1, which represents the largest respondent category. In sum, the respondents were almost equally split in their responses regarding if a woman should have an abortion for any reason. Approx. 49% (n=760) stated no. AGE Interval As it relates to the ages of the respondents, the average age is about 49 (SD=18.061). The minimum age is 18 and the maximum age of respondents is 89. In sum, the ages of the respondents varied, with majority of them being between the ages of 48-49. ATTEND - Ordinal As it relates to ATTEND, approximately 30.7% (n=716) never attend religious services. Only 5.5% (n=129) stated that they attend services more than once a week. The median for this variable is 3, which reflects those respondents who attend several times a year. In sum, majority of the respondents in the data set don't attend religious activities/services
Step by Step Solution
There are 3 Steps involved in it
Step: 1
Get Instant Access to Expert-Tailored Solutions
See step-by-step solutions with expert insights and AI powered tools for academic success
Step: 2
Step: 3
Ace Your Homework with AI
Get the answers you need in no time with our AI-driven, step-by-step assistance