Answered step by step
Verified Expert Solution
Link Copied!

Question

1 Approved Answer

Demand (D)=88 units/week (Assume 52 weeks per year) Ordering and setup cost (S)=$90 /order > Holding cost (H)=$18/ unit/year Data Table > Lead time (L)=1
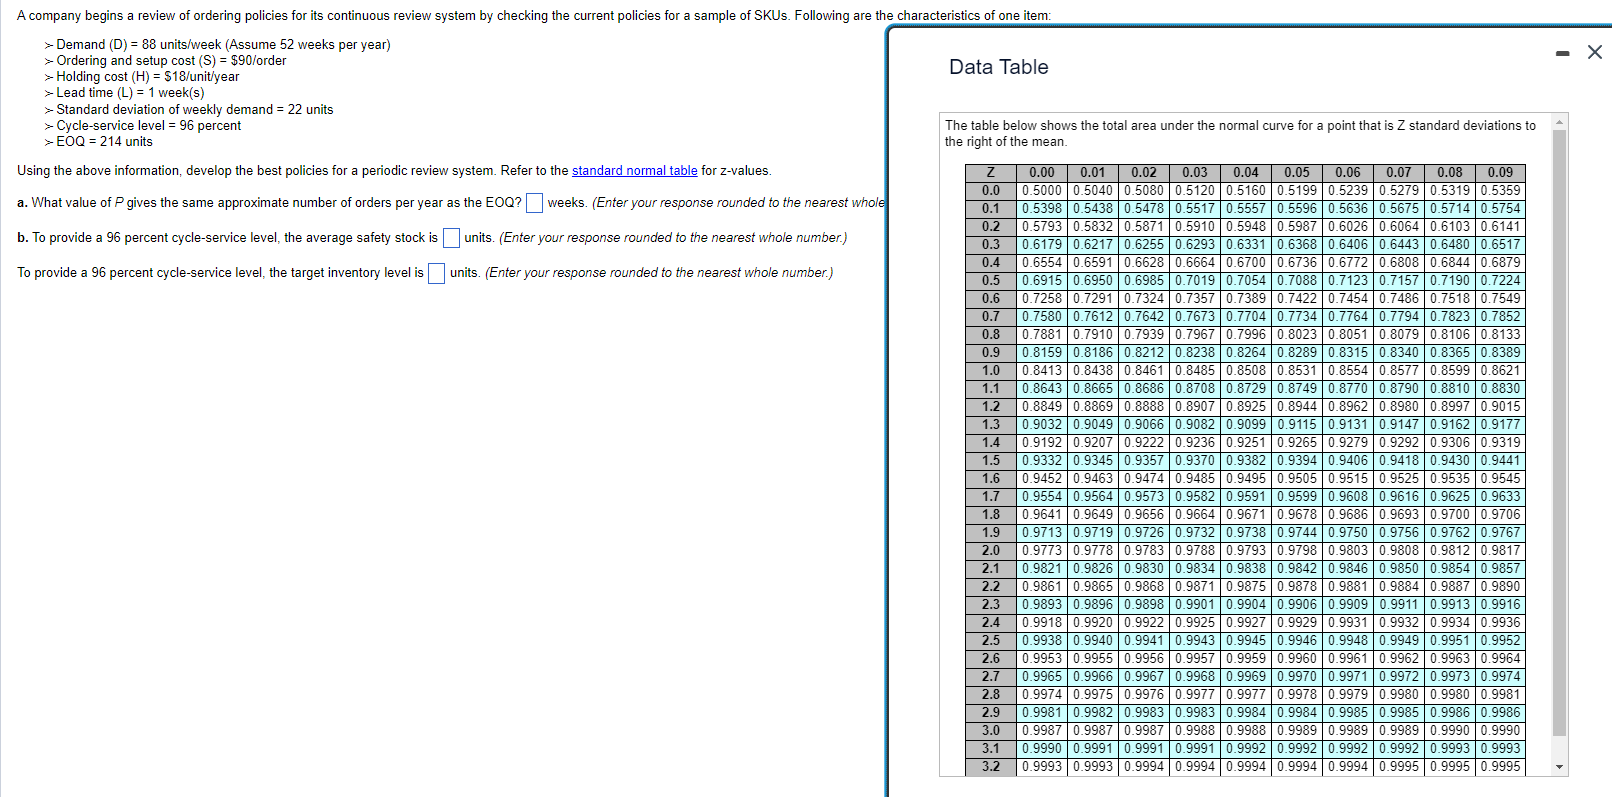
image text in transcribed

Demand (D)=88 units/week (Assume 52 weeks per year) Ordering and setup cost (S)=$90 /order > Holding cost (H)=$18/ unit/year Data Table > Lead time (L)=1 week (s) Standard deviation of weekly demand =22 units Cycle-service level =96 percent The table below shows the total area under the normal curve for a point that is Z standard deviations to EOQ=214 units the right of the mean. Using the above information, develop the best policies for a periodic review system. Refer to the standard normal table for z-values. a. What value of P gives the same approximate number of orders per year as the EOQ ? weeks. (Enter your response rounded to the nearest whole b. To provide a 96 percent cycle-service level, the average safety stock is units. (Enter your response rounded to the nearest whole number.) To provide a 96 percent cycle-service level, the target inventory level is units. (Enter your response rounded to the nearest whole number.)

Step by Step Solution

There are 3 Steps involved in it

Step: 1

blur-text-image

Get Instant Access to Expert-Tailored Solutions

See step-by-step solutions with expert insights and AI powered tools for academic success

Step: 2

blur-text-image

Step: 3

blur-text-image

Ace Your Homework with AI

Get the answers you need in no time with our AI-driven, step-by-step assistance

Get Started

Recommended Textbook for

Contemporary Strategy Analysis Text and Cases

Authors: Robert M. Grant

9th edition

978-1119120841, 1119120845, 978-1119120834

More Books

Students also viewed these General Management questions

Question

1.2 Why is the aggregate demand curve downward sloping?

Answered: 1 week ago