Question
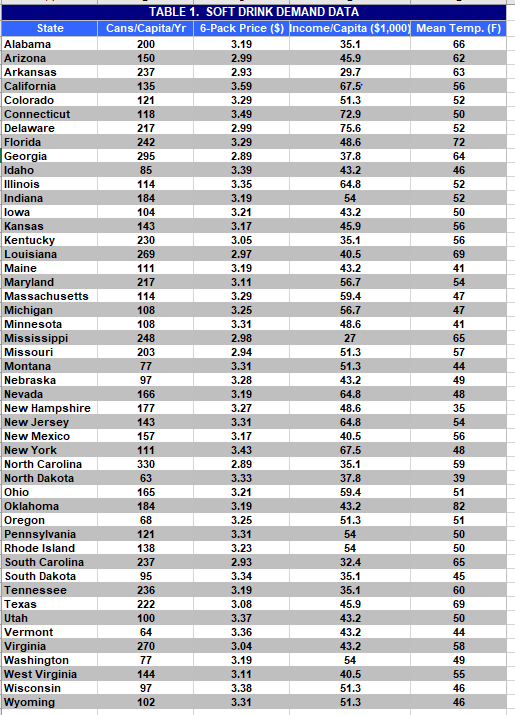
DEMAND ESTIMATION and ELASTICITY: Soft Drinks in the U.S. Demand can be estimated with experimental data, time-series data, or cross-section data. In this case, cross-section
DEMAND ESTIMATION and ELASTICITY: Soft Drinks in the U.S. Demand can be estimated with experimental data, time-series data, or cross-section data. In this case, cross-section data appear in the Excel file. Soft drink consumption in cans per capita per year is related to six-pack price, income per capita, and mean temperature across the 48 contiguous states in the United States.
QUESTIONS
1. Given the data, please construct the demand estimation for soft drink consumption in the United States by (1) a multiple-linear regression equation (10%), and (2) a log-linear (exponential) regression equation (10%).
2. Given the MS Excel output in Question 1, please compare the two regression equations' coefficient of determination (R-square), F-test and t-test. Which equation is a good (better) fit? Which equation shows the stronger overall significance to predict the future demand? Which equation will you choose as a better estimation for quantity demanded? Which equation will you choose as a better estimation for elasticities? Explain your answer in the language of statistics. (20%)
3. Please interpret the coefficient of each independent variable in the multiple-linear soft drink demand estimated equation. (15%)
4. Given the multiple-linear equation, how many cans/capita/year on soft drink should be for a state in which 6-pack price=$2.99, Income/Capita=$48,500, and Mean Temp= 64F? (15%)
5. Given the log-linear equation, please provide the price elasticity of demand and income elasticity. Comment on whether the demand is elastic or inelastic and whether soft drink is a necessity, normal good or luxury good. (15%)
6. Now omit both price and temperature from the regression equation then run the simple linear regression again. Given the Excel output of only one independent variable, income, should a marketing plan for soft drinks be designed that relocates most canned drink vending machines into low-income neighborhoods? Please explain your answer in the language of economics. (15%)

Step by Step Solution
There are 3 Steps involved in it
Step: 1

Get Instant Access to Expert-Tailored Solutions
See step-by-step solutions with expert insights and AI powered tools for academic success
Step: 2

Step: 3

Ace Your Homework with AI
Get the answers you need in no time with our AI-driven, step-by-step assistance
Get Started


