

Question
Demand Estimation for the Urgent Healthcare Clinic Consider the hypothetical example of the Urgent Healthcare Clinic (UHC), a chain of urgent care facilities in 35
Demand Estimation for the Urgent Healthcare Clinic
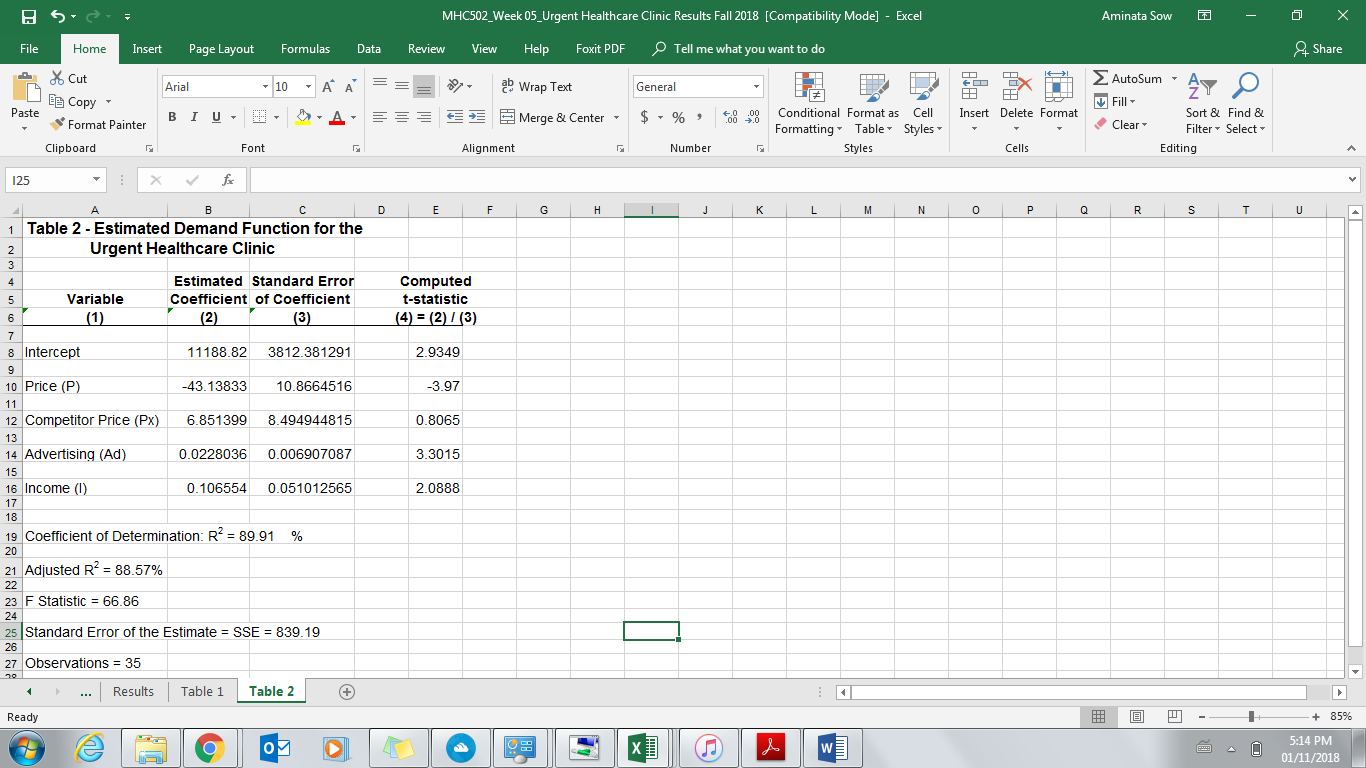
Consider the hypothetical example of the Urgent Healthcare Clinic (UHC), a chain of urgent care facilities in 35 regional areas across the U.S.Management of the Urgent Healthcare Clinics has initiated an empirical estimation of customer traffic at their 35 regional locations to help the clinics formulate updates to patient pricing and possible expansion plans for the coming year.Annual operating data for 35 regions appear in the attached spreadsheet (Table 1).Regression results also in the spreadsheet (Results/Table 2).
The following regression equation was fit to these data:
Qi = b0 + b1Pi + b2Pxi + b3Adi + b4Ii + uit.
Where: Q is the number of annual patients serviced,
P is the average price charged per patient visit (patient amount, in dollars),
Px is the average price per patient charged by competing facilities (in $)
Ad is the local advertising budget for facilities in each region (in $),
I is the average income per household in each region's service area,
ui is a residual (or disturbance) term.
The subscript indicates each of the 35 regional markets (i = 1,..., 35) from which the observation was taken.Least squares estimation of the regression equation on the basis of the 35 data cross-sectional observations resulted in the estimated regression coefficients and other statistics as shown in the results and in Table 2.
A.Describe the economic meaning for the individual independent variables included in the Urgent Healthcare Clinic demand equation.Interpret each estimated coefficient and its impact on the dependent variable (number of patients serviced)?
B.Using the estimates from the regression analysis, compute the expected (average) unit sales and average sales revenue for a typical region? (Assume that all independent variables are statistically significant in your computations).
C.From the regression estimates develop a demand equation for Urgent Healthcare Clinic.Use each coefficient average (at the bottom on Table 1) for the non-price variables to develop the demand equation. (Again, assume that all independent variables are statistically significant in your demand equation computation and the variables Px, Ad and I are held constant in the development of the demand curve). Q = f(P | Px, Ad, I)
D.Develop the null and alternative hypothesis for the b1 coefficient (average price per patient - one-tail test), the b2 coefficient (average price charged by competition - one tail test) and the b3 coefficient (advertising variable - two tail test). Briefly describe when it is appropriate to use a one-tail test relative compared to a two-tailed t-test?Use a t-test to determine the level statistical significance for each individual independent variables at the 95 and 99 percent confidence levels.
E.Briefly explain the terminology of the coefficient of determination (R2).If one of the independent variables was found to not be statistically significant, what changes might you perform to the original regression equation?
F.Develop the null and alternative hypothesis and conduct an F-test for the complete set of coefficients in the equation to determine the significance at the 95 and 99 percent levels.


Step by Step Solution
There are 3 Steps involved in it
Step: 1

Get Instant Access to Expert-Tailored Solutions
See step-by-step solutions with expert insights and AI powered tools for academic success
Step: 2

Step: 3
Ace Your Homework with AI
Get the answers you need in no time with our AI-driven, step-by-step assistance
Get Started
Algebra 1, Volume 2
Authors: Edward B. Burger, Juli K. Dixon, Steven J. Leinwand, Timothy D. Kanold
Student Edition
0544368185, 978-0544368187