Answered step by step
Verified Expert Solution
Question
1 Approved Answer
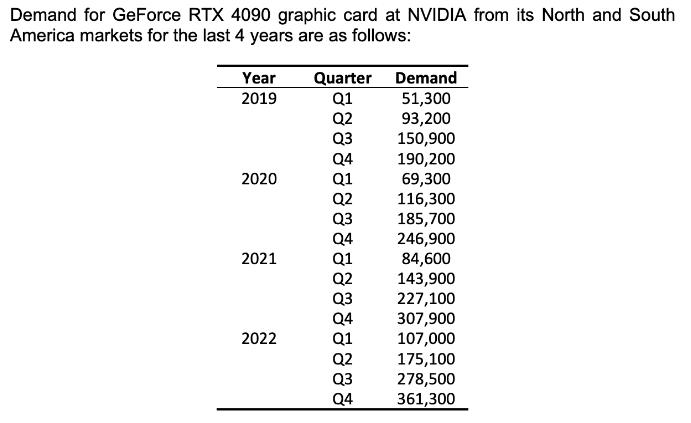
Demand for GeForce RTX 4090 graphic card at NVIDIA from its North and South America markets for the last 4 years are as follows:


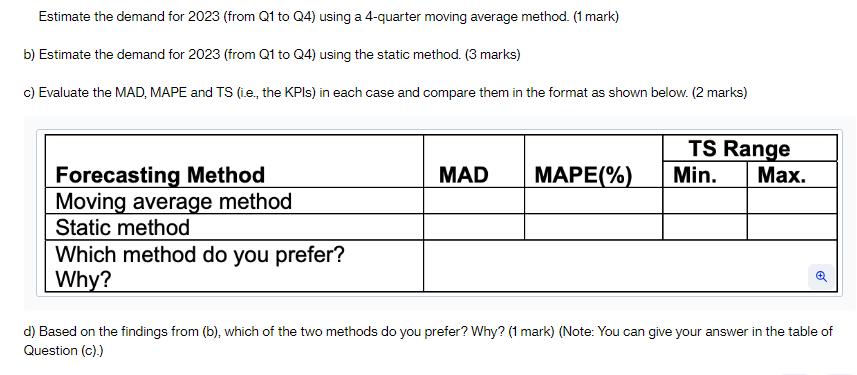
Demand for GeForce RTX 4090 graphic card at NVIDIA from its North and South America markets for the last 4 years are as follows: Year 2019 2020 2021 2022 Quarter Q1 Q2 Q3 Q3 Q4 Q3 Q2 Q3 Q4 Demand 51,300 93,200 150,900 190,200 69,300 116,300 185,700 246,900 84,600 143,900 227,100 307,900 107,000 175,100 278,500 361,300 Estimate the demand for 2023 (from Q1 to Q4) using a 4-quarter moving average method. (1 mark) b) Estimate the demand for 2023 (from Q1 to Q4) using the static method. (3 marks) c) Evaluate the MAD, MAPE and TS (i.e., the KPIs) in each case and compare them in the format as shown below. (2 marks) Forecasting Method Moving average method Static method Which method do you prefer? Why? MAD MAPE(%) TS Range Min. Max. d) Based on the findings from (b), which of the two methods do you prefer? Why? (1 mark) (Note: You can give your answer in the table of Question (c).)
Step by Step Solution
★★★★★
3.41 Rating (151 Votes )
There are 3 Steps involved in it
Step: 1
a Estimate the demand for 2023 using a 4quarter moving average method To calculate the demand for 20...
Get Instant Access to Expert-Tailored Solutions
See step-by-step solutions with expert insights and AI powered tools for academic success
Step: 2

Step: 3

Ace Your Homework with AI
Get the answers you need in no time with our AI-driven, step-by-step assistance
Get Started


