

Question
Demonstrate your ability to use the Statistical Package for the Social Sciences (SPSS) software to perform statistical analysis of a data set. 1. Generate a
Demonstrate your ability to use the Statistical Package for the Social Sciences (SPSS)
software to perform statistical analysis of a data set.
1. Generate a boxplot for group A and group B to check for data outliers and remove
any outliers from your subsequent analysis, if present.
2. Create frequency histogram for group A and group B to check the distribution of
the data and decide which parametric or non-parametric test is appropriate to
compare the two groups.
3. Use the appropriate normality test to determine the distribution of groups A and B,
and use the correct inferential statistical test to compare the two groups. Decide if
there is a significant difference in the measure of central tendency for the two
groups.
Write the abstract to report the findings of Part 1. This should include:
1. Aim: one or two sentences describing the purpose of the research study; a short
background to the study is included with each data set.
2. Methods: describe which statistical methods were applied in SPSS
3. Results: report the key summary statistics and P value using conventions required for
formal reporting of statistical results
4. Conclusion: briefly describe the significance of your results
Please solve this.
data link - https://drive.google.com/file/d/1hiu6Pz2LwCvwdwIb7pL7wNB7WfZWcNp0/view?usp=sharing
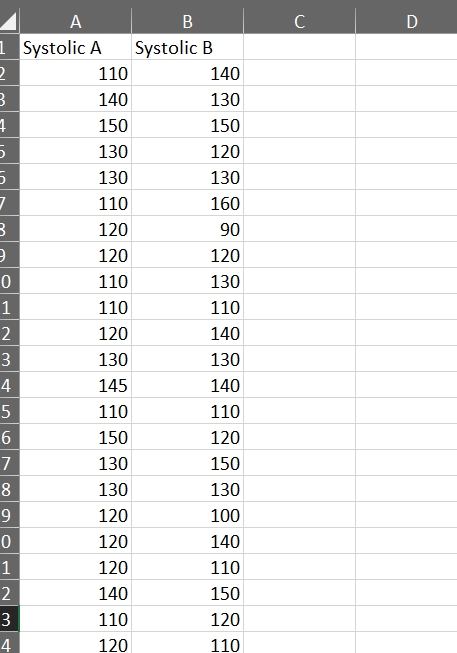
The BP data consists of adults taking part in a public health lifestyle intervention program for smoking cessation and exercise (group A) compared to adults who still smoke and are not physically active (group B). Please compare the outcomes from the data collected at 6 months, perform the analysis in SPSS, and report the findings in abstract format according to the brief.
Step by Step Solution
There are 3 Steps involved in it
Step: 1

Get Instant Access to Expert-Tailored Solutions
See step-by-step solutions with expert insights and AI powered tools for academic success
Step: 2

Step: 3
Ace Your Homework with AI
Get the answers you need in no time with our AI-driven, step-by-step assistance
Get Started
Finite Math And Applied Calculus
Authors: Stefan Waner, Steven Costenoble
6th Edition
1285415132, 9781285415130