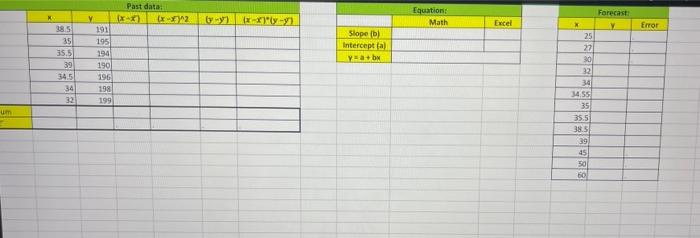
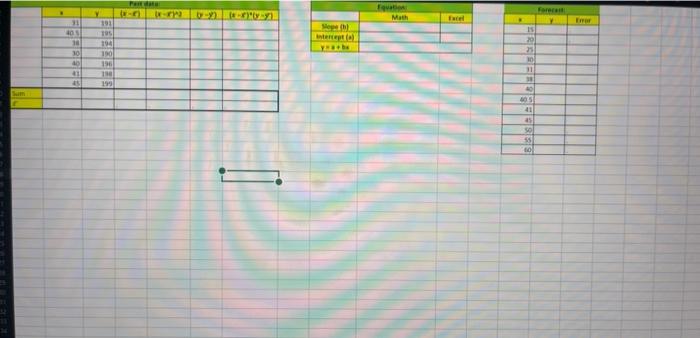
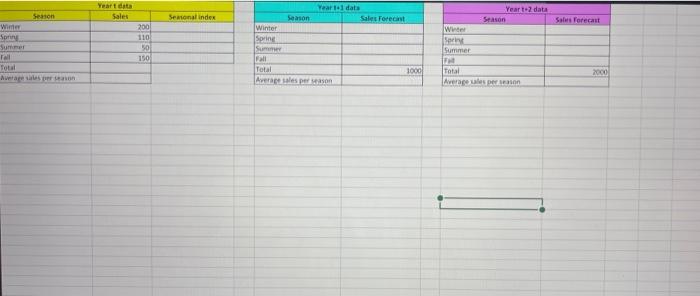
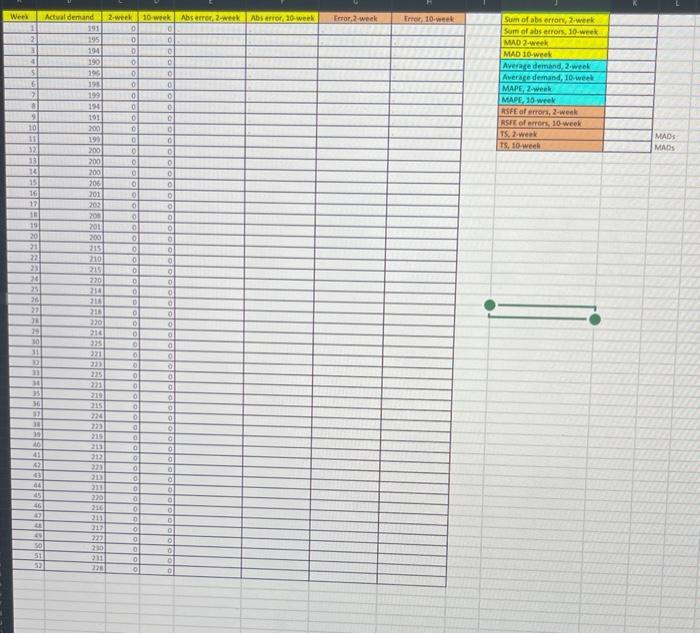
Dependent variable = demand Independent variable = price Calculate slope, intercept, and the trend line formula using the least square method. Use the (1) step-by-step calculation and (2) Excel formulas) Forecast the demand for the price =25,27,30,45,50,60 Create the plot (trend and forecast vs.actual demand) Intepret your results (1530 words ) Dependent variable = demand Independent variable e price of the substitute food Calculate slope, intercept, and the trend line formula using the least square method. Use the (1) step-by-step calculation and (2) Excel formulas) Forecast the demand for the price =15,20,25,50,55,60 Create the phot (trend and forecast vs. actual demand) intepret your results ( 1530 words) Calculate seasonal indices for Winter, Spring, Sammer, and Fall Forecast the demand for years t+1 and t+1 Insert the bar chart for year t+2 (winter, spring, summer, fall, and average) intepret your results (15-30 words) Calculate overall MAD, MAPE, and TS for the 2-week and 10-werit forecasts Intepret yaur results (15-30 words] \begin{tabular}{|r|r|r|r|r|r|} \hline \multicolumn{1}{|r|}{ Y Past data: } & (xx) & (xx)n2 & (yy) & (xx)(yy) \\ \hline 38.5 & 191 & & & & \\ \hline 35 & 195 & & & & \\ \hline 35.5 & 199 & & & & \\ \hline 39 & 190 & & & & \\ \hline 34.5 & 196 & & & & \\ \hline 34 & 198 & & & & \\ \hline 32 & 199 & & & & \\ \hline & & & & & \\ \hline \end{tabular} Dependent variable = demand Independent variable = price Calculate slope, intercept, and the trend line formula using the least square method. Use the (1) step-by-step calculation and (2) Excel formulas) Forecast the demand for the price =25,27,30,45,50,60 Create the plot (trend and forecast vs.actual demand) Intepret your results (1530 words ) Dependent variable = demand Independent variable e price of the substitute food Calculate slope, intercept, and the trend line formula using the least square method. Use the (1) step-by-step calculation and (2) Excel formulas) Forecast the demand for the price =15,20,25,50,55,60 Create the phot (trend and forecast vs. actual demand) intepret your results ( 1530 words) Calculate seasonal indices for Winter, Spring, Sammer, and Fall Forecast the demand for years t+1 and t+1 Insert the bar chart for year t+2 (winter, spring, summer, fall, and average) intepret your results (15-30 words) Calculate overall MAD, MAPE, and TS for the 2-week and 10-werit forecasts Intepret yaur results (15-30 words] \begin{tabular}{|r|r|r|r|r|r|} \hline \multicolumn{1}{|r|}{ Y Past data: } & (xx) & (xx)n2 & (yy) & (xx)(yy) \\ \hline 38.5 & 191 & & & & \\ \hline 35 & 195 & & & & \\ \hline 35.5 & 199 & & & & \\ \hline 39 & 190 & & & & \\ \hline 34.5 & 196 & & & & \\ \hline 34 & 198 & & & & \\ \hline 32 & 199 & & & & \\ \hline & & & & & \\ \hline \end{tabular}


