Answered step by step
Verified Expert Solution
Question
1 Approved Answer
Derive (manually) the reliability equation of the system shown below. This is a complex dynamic system and the failure distribution for each component is shown
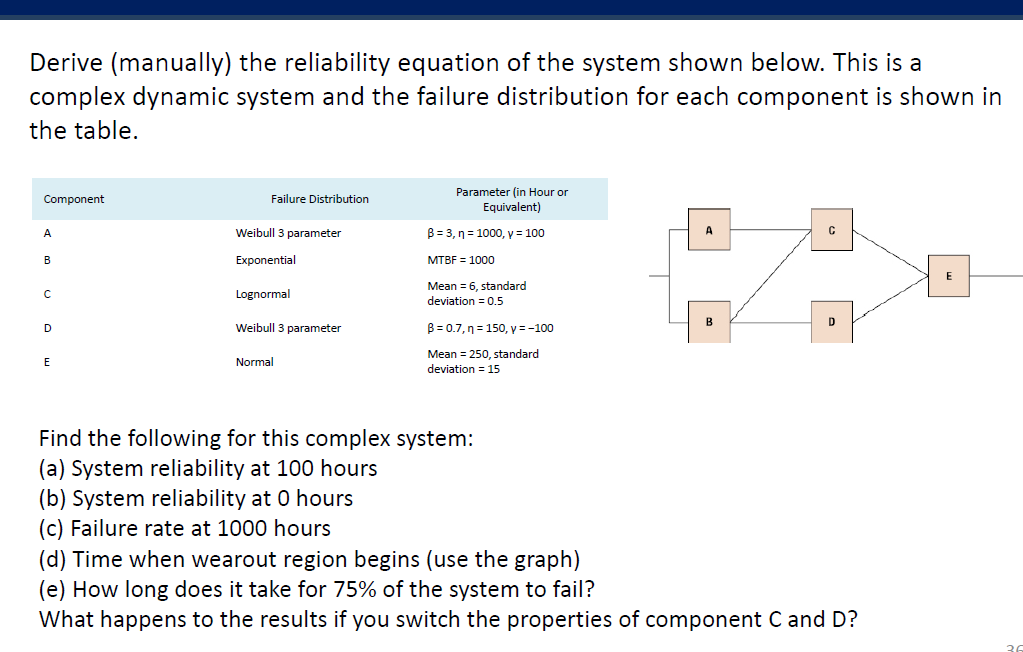
Derive (manually) the reliability equation of the system shown below. This is a complex dynamic system and the failure distribution for each component is shown in the table. Parameter (in Hour or Equivalent) Component Failure Distribution Weibull 3 parameter -3, = 1000, = 100 MTBF 1000 Mean 6, standard deviation 0.5 8-07, = 150, =-100 Mean 250, standard Exponential Weibull 3 parameter deviation = 15 Find the following for this complex system: (a) System reliability at 100 hours (b) System reliability at O hours (c) Failure rate at 1000 hours (d) Time when wearout region begins (use the graph) (e) How long does it take for 75% of the system to fail? What happens to the results if you switch the properties of component C and D? Derive (manually) the reliability equation of the system shown below. This is a complex dynamic system and the failure distribution for each component is shown in the table. Parameter (in Hour or Equivalent) Component Failure Distribution Weibull 3 parameter -3, = 1000, = 100 MTBF 1000 Mean 6, standard deviation 0.5 8-07, = 150, =-100 Mean 250, standard Exponential Weibull 3 parameter deviation = 15 Find the following for this complex system: (a) System reliability at 100 hours (b) System reliability at O hours (c) Failure rate at 1000 hours (d) Time when wearout region begins (use the graph) (e) How long does it take for 75% of the system to fail? What happens to the results if you switch the properties of component C and D
Step by Step Solution
There are 3 Steps involved in it
Step: 1
Get Instant Access to Expert-Tailored Solutions
See step-by-step solutions with expert insights and AI powered tools for academic success
Step: 2
Step: 3
Ace Your Homework with AI
Get the answers you need in no time with our AI-driven, step-by-step assistance
Get Started