Answered step by step
Verified Expert Solution
Question
1 Approved Answer
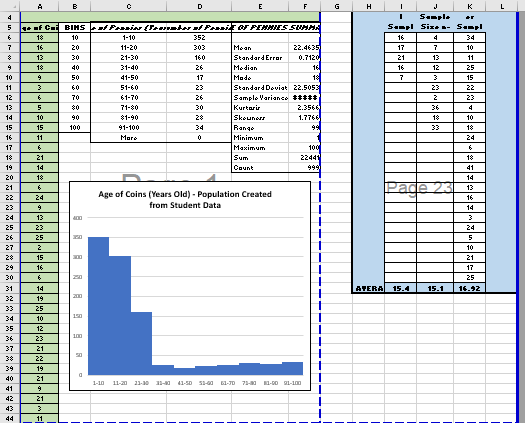
Describe the distribution shape of the population of penny ages (i.e., left skewed, symmetric, right skewed). On your copy of the Penny Population document, randomly
- Describe the distributionshape of the populationof penny ages (i.e., left skewed, symmetric, right skewed).
- On your copy of the Penny Population document, randomly select 5 penny ages from this population. Calculate the mean of this Nickel Sample (sample size n = 5). How does this compare to the population mean?
- On your copy of the Penny Population document, randomly select 10 penny ages from this population. Calculate the mean of this Dime Sample (sample size n = 10). How does this compare to the population mean?
- On your copy of the Penny Population document, randomly select 25 penny ages from this population. Calculate the mean of this Quarter Sample (sample size n = 25). How does this compare to the population mean?

Step by Step Solution
There are 3 Steps involved in it
Step: 1

Get Instant Access to Expert-Tailored Solutions
See step-by-step solutions with expert insights and AI powered tools for academic success
Step: 2

Step: 3

Ace Your Homework with AI
Get the answers you need in no time with our AI-driven, step-by-step assistance
Get Started


