

Answered step by step
Verified Expert Solution
Question
1 Approved Answer
Describe the two points on the graph that move as you adjust the Quantity slider. check all that apply (there is more than one answer)
Describe the two points on the graph that move as you adjust the Quantity slider.
check all that apply (there is more than one answer)
- The point where MC intersects MR.
- The point on the D curve for the chosen quantity.
- The point where MC intersects D.
- The point on the MC curve for the chosen quantity.
- The point on the ATC curve for the chosen quantity.
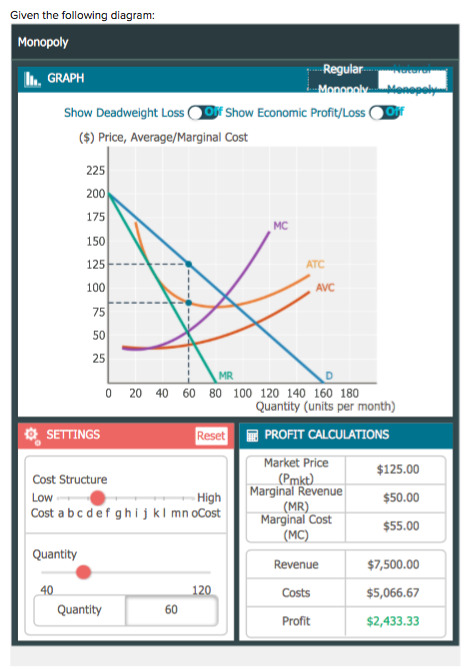 Given the following diagram: Monopoly In. GRAPH Regular Monopoly Show Deadweight Loss (Off Show Economic Profit/Loss ( Off ($) Price, Average/Marginal Cost 225 200 175 MC 150 125 ATC 100 AVC 75 50 25 MR D 0 20 40 60 80 100 120 140 160 180 Quantity (units per month) SETTINGS Reset PROFIT CALCULATIONS Market Price $125.00 Cost Structure (Pmkt) Low High Marginal Revenue $50.00 Cost abcdefghij kl mn oCost (MR) Marginal Cost $55.00 (MC) Quantity Revenue $7,500.00 40 120 Costs $5,066.67 Quantity 60 Profit $2,433.33
Step by Step Solution
There are 3 Steps involved in it
Step: 1

Get Instant Access to Expert-Tailored Solutions
See step-by-step solutions with expert insights and AI powered tools for academic success
Step: 2

Step: 3
Ace Your Homework with AI
Get the answers you need in no time with our AI-driven, step-by-step assistance
Get Started
Microeconomics and Behavior
Authors: Robert Frank
9th edition
9780077723750, 78021693, 77723759, 978-0078021695