

Description du problme In this programming assignment, you will implement a data clustering algorithm named DBSCAN...
Fantastic news! We've Found the answer you've been seeking!
Question:
Transcribed Image Text:
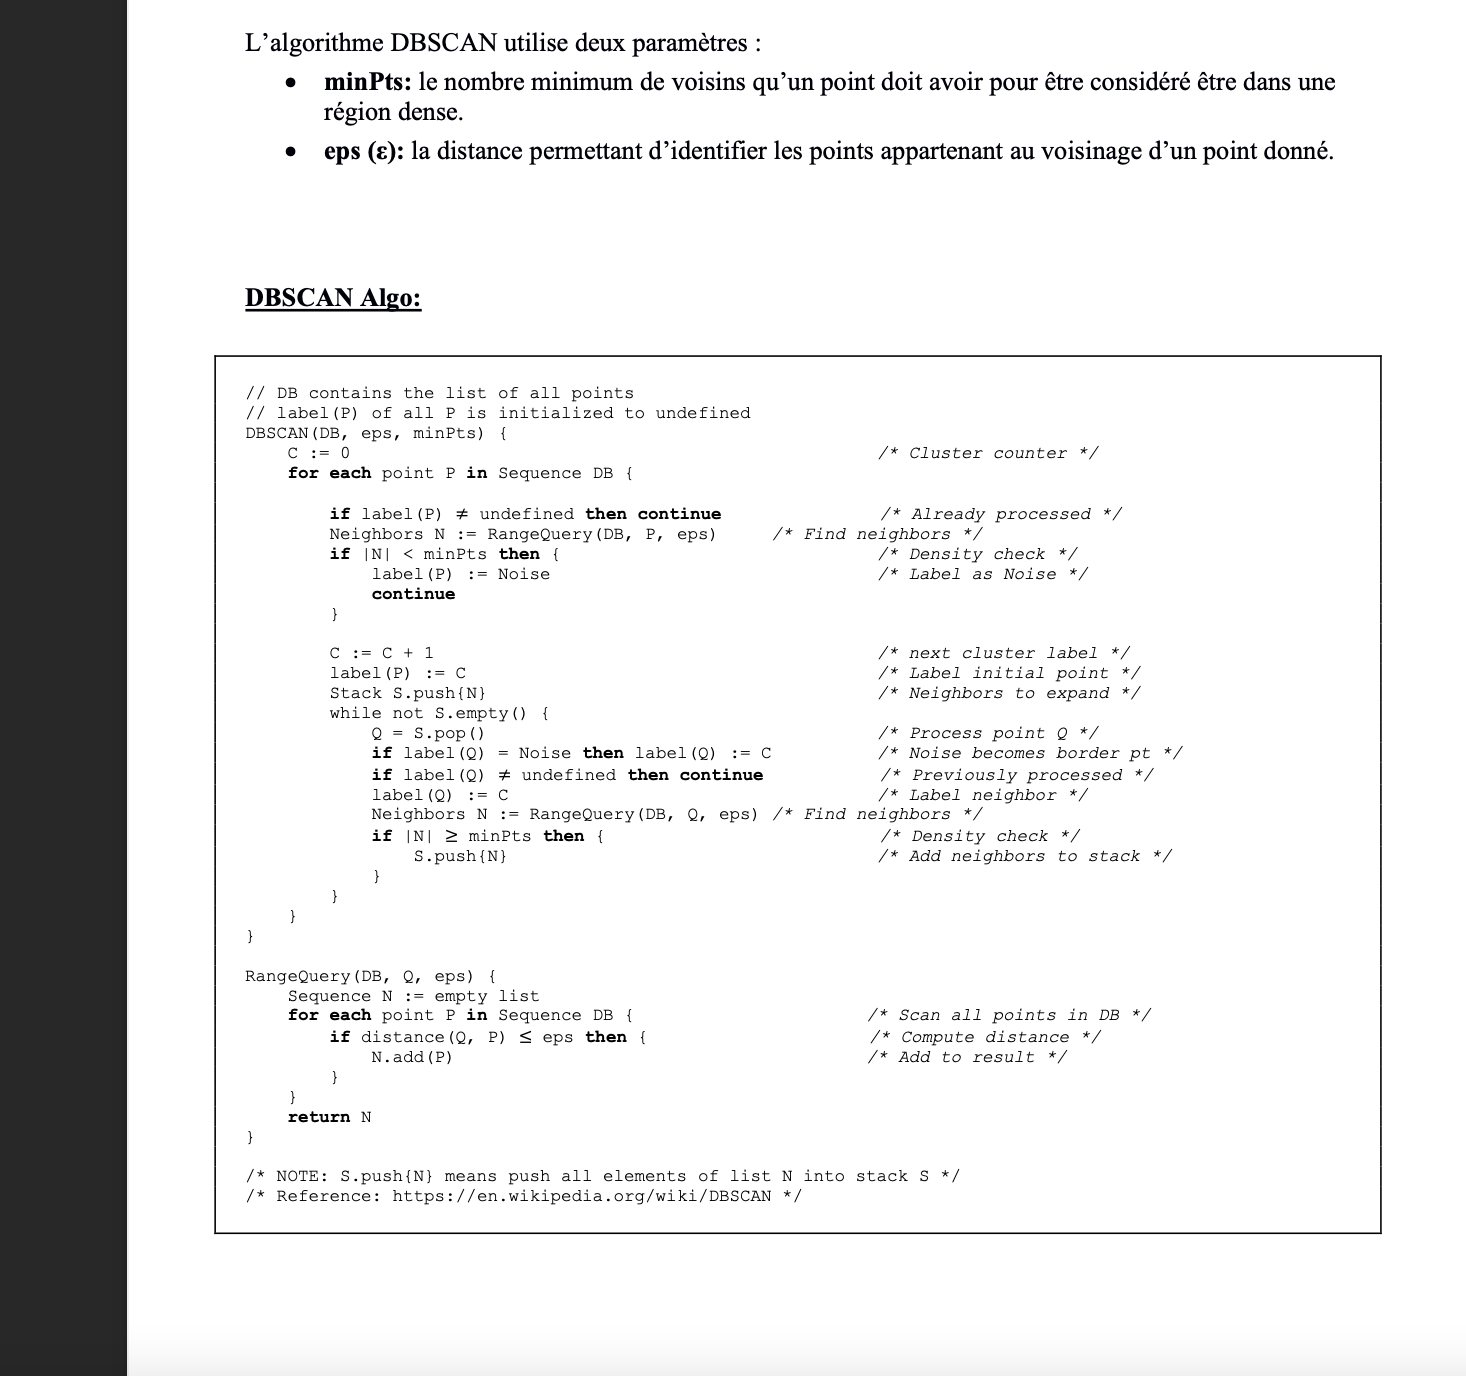
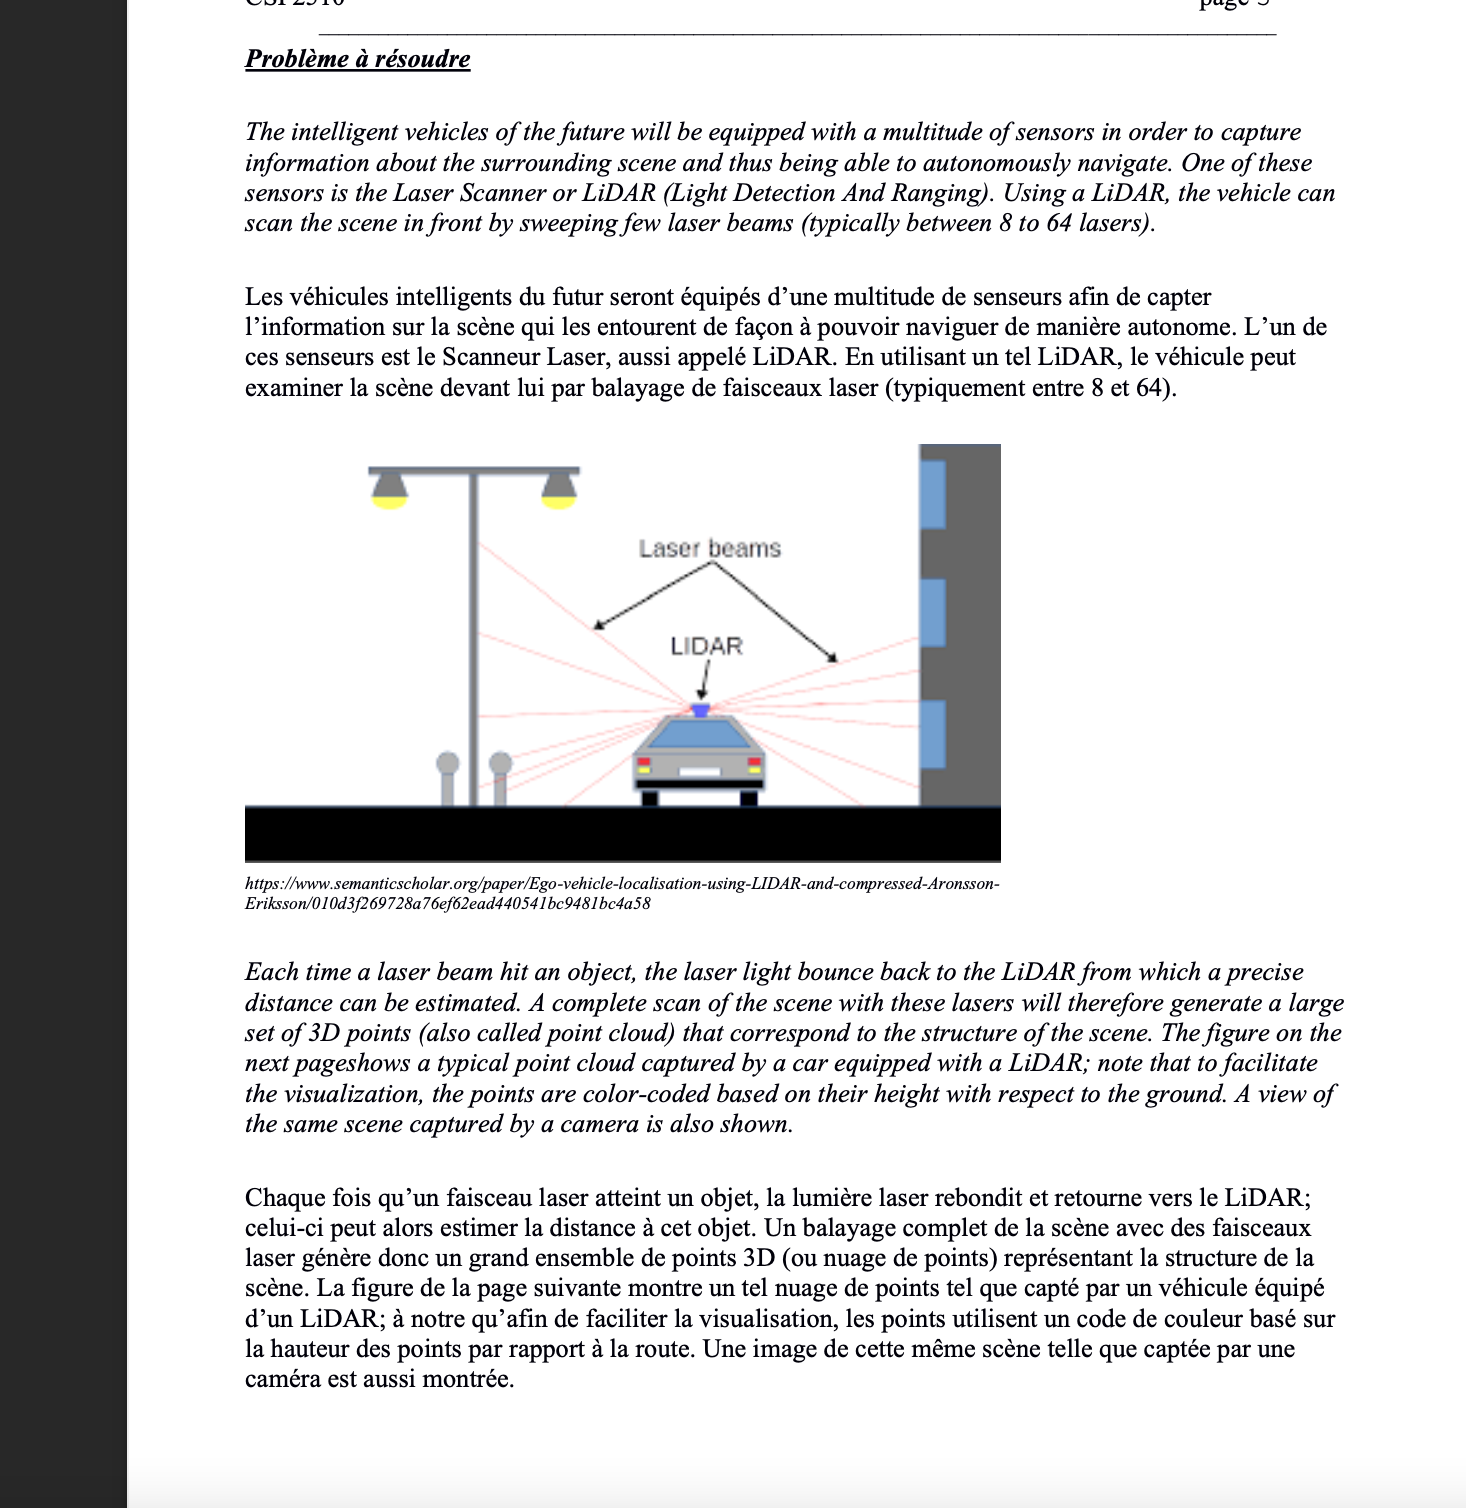
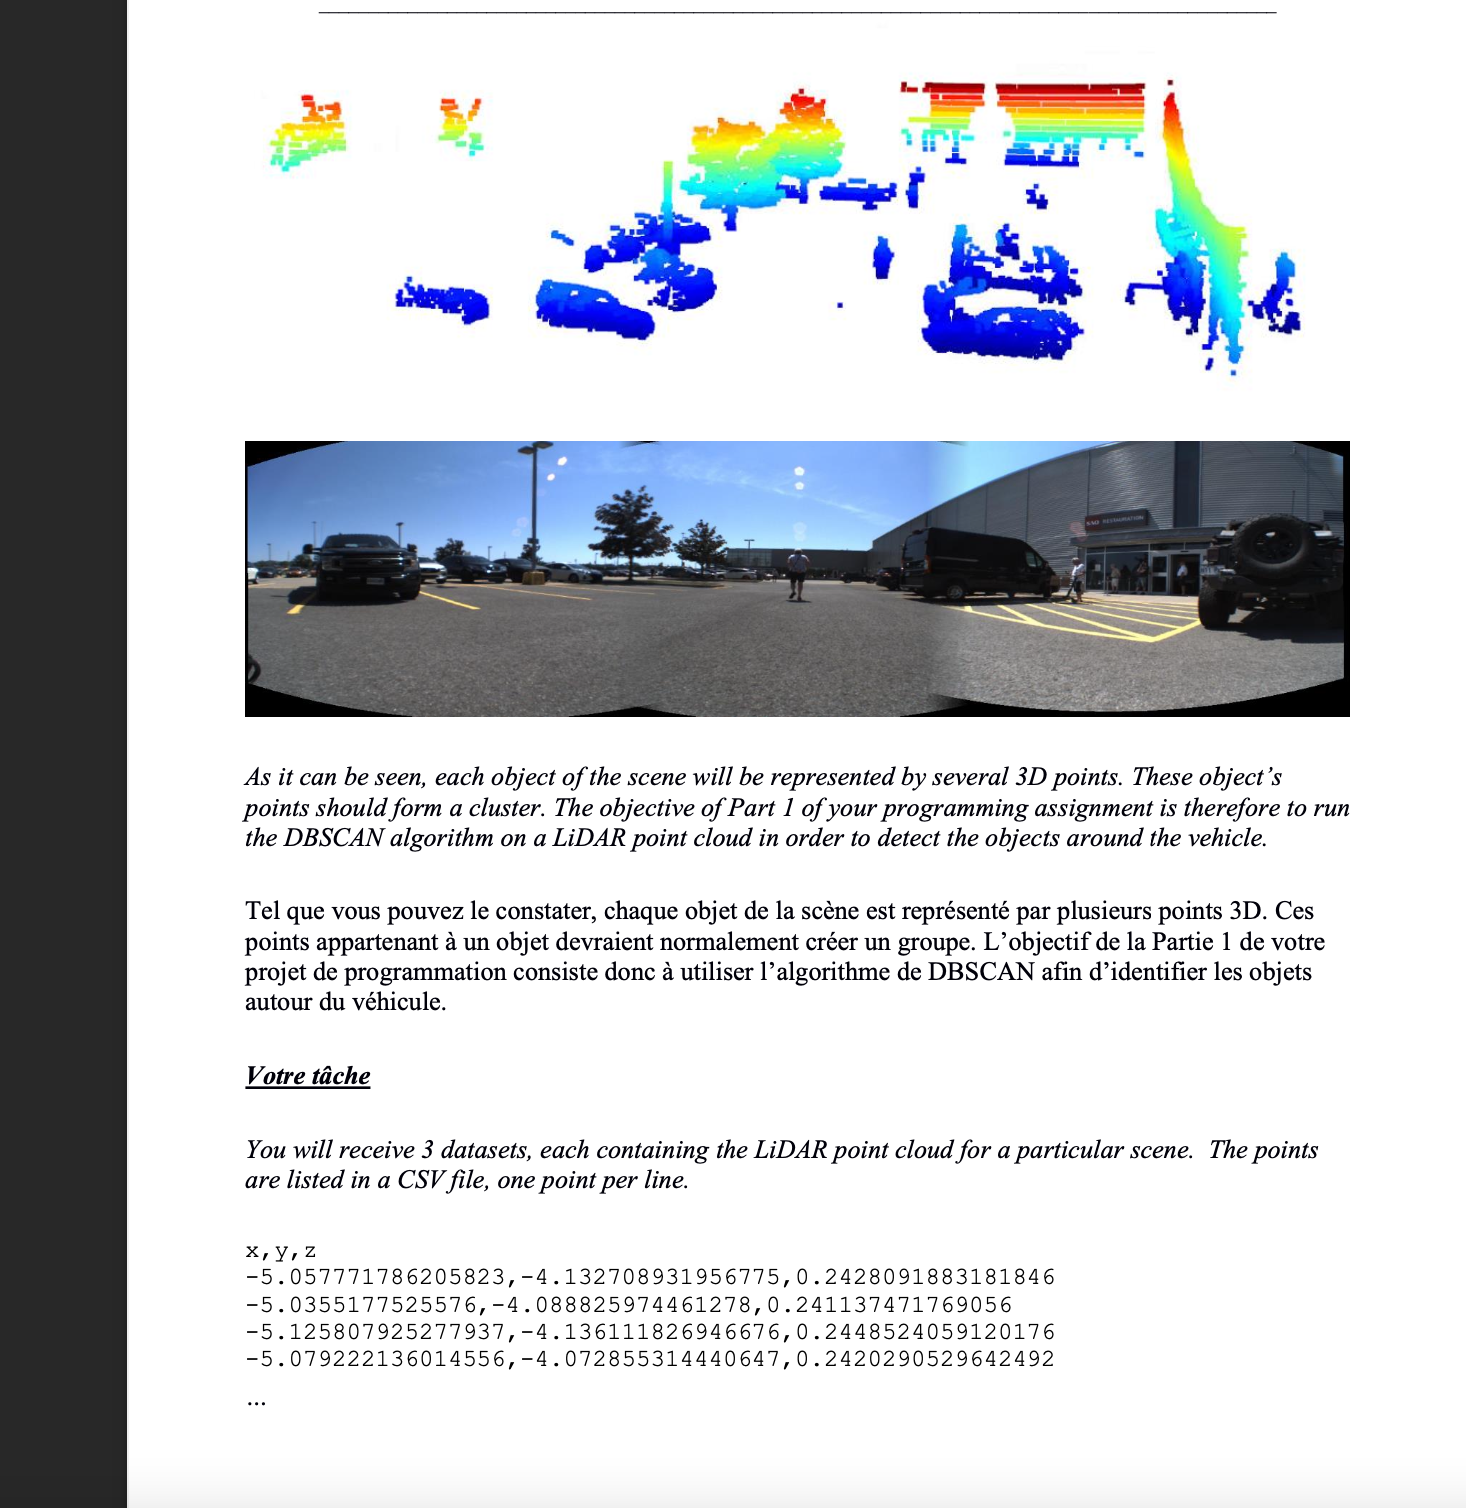
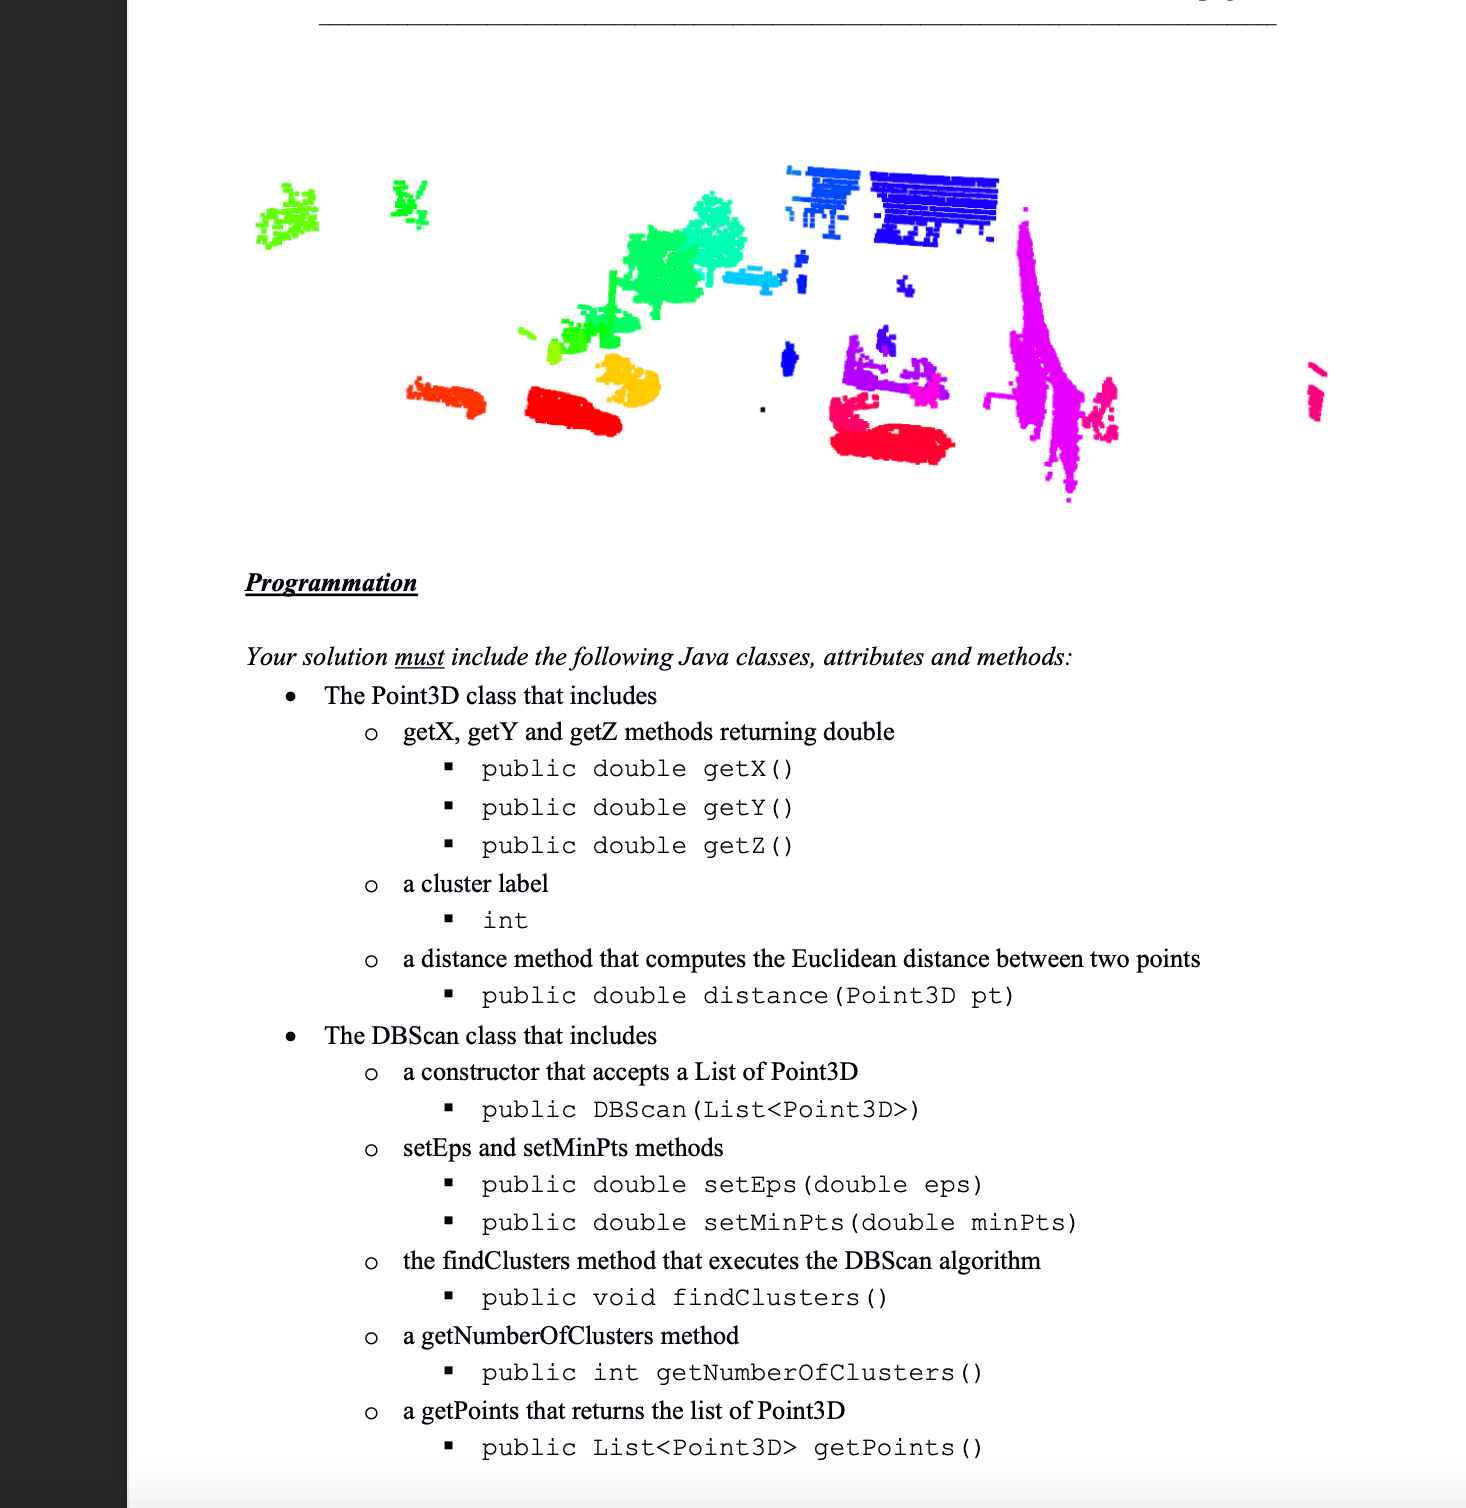
Description du problème In this programming assignment, you will implement a data clustering algorithm named DBSCAN - Density-Based Spatial Clustering of Applications with Noise. Given a large set of data points in a space of arbitrary dimension and given a distance metric, this algorithm can discover clusters of different shapes and sizes, marking as outliers isolated points in low-density regions (i.e. points whose nearest neighbors are too far away). The DBSCAN algorithm uses two parameters: • . minPts: The minimum number of points (a threshold) in the neighborhood of a point for this one to be considered to belong to a dense region. eps (ε): A distance measure that is used to identify the points in the neighborhood of any point. Cet exercice de programmation vous demande de programmer un algorithme de groupement de données appelé DBSCAN. Soit un ensemble de points dans un espace de dimension quelconque et soit une métrique de distance, cet algorithme permet de trouver les groupements de points de dimension et formes diverses tout en identifiant les points isolés n'appartement à aucun groupement (i.e. les points pour lesquels leurs plus proches voisins sont éloignés). L'algorithme DBSCAN utilise deux paramètres : • • minPts: le nombre minimum de voisins qu'un point doit avoir pour être considéré être dans une région dense. eps (E): la distance permettant d'identifier les points appartenant au voisinage d'un point donné. DBSCAN Algo: // DB contains the list of all points // label (P) of all P is initialized to undefined DBSCAN (DB, eps, minPts) C = 0 { for each point P in Sequence DB { if label (P) # undefined then continue Neighbors N = RangeQuery (DB, P, eps) if NminPts then { } label (P) = Noise continue C=C1 label (P) = C Stack S.push {N} while not S.empty() { Q = s.pop() if label (Q) = Noise then label (Q) = C if label (Q) undefined then continue label (Q) = C /* Cluster counter */ /* Already processed */ /* Find neighbors */ /* Density check */ /* Label as Noise */ /* next cluster label */ /* Label initial point */ /* Neighbors to expand */ /* Process point Q */ /* Noise becomes border pt */ /* Previously processed */ /* Label neighbor */ Neighbors N = RangeQuery (DB, Q, eps) /* Find neighbors */ if N minPts then { S.push{N} /* Density check */ /* Add neighbors to stack */ RangeQuery (DB, Q, eps) { Sequence N := empty list for each point P in Sequence DB { if distance (Q, P) ≤ eps then ( N.add(P) /* Scan all points in DB */ /* Compute distance */ /* Add to result */ } } return N } /* NOTE: S.push(N) means push all elements of list N into stack S */ /* Reference: https://en.wikipedia.org/wiki/DBSCAN */ Problème à résoudre The intelligent vehicles of the future will be equipped with a multitude of sensors in order to capture information about the surrounding scene and thus being able to autonomously navigate. One of these sensors is the Laser Scanner or LiDAR (Light Detection And Ranging). Using a LiDAR, the vehicle can scan the scene in front by sweeping few laser beams (typically between 8 to 64 lasers). Les véhicules intelligents du futur seront équipés d'une multitude de senseurs afin de capter l'information sur la scène qui les entourent de façon à pouvoir naviguer de manière autonome. L'un de ces senseurs est le Scanneur Laser, aussi appelé LiDAR. En utilisant un tel LiDAR, le véhicule peut examiner la scène devant lui par balayage de faisceaux laser (typiquement entre 8 et 64). T Laser beams LIDAR https://www.semanticscholar.org/paper/Ego-vehicle-localisation-using-LIDAR-and-compressed-Aronsson- Eriksson/010d3f269728a76ef62ead440541bc9481bc4a58 Each time a laser beam hit an object, the laser light bounce back to the LiDAR from which a precise distance can be estimated. A complete scan of the scene with these lasers will therefore generate a large set of 3D points (also called point cloud) that correspond to the structure of the scene. The figure on the next pageshows a typical point cloud captured by a car equipped with a LiDAR; note that to facilitate the visualization, the points are color-coded based on their height with respect to the ground. A view of the same scene captured by a camera is also shown. Chaque fois qu'un faisceau laser atteint un objet, la lumière laser rebondit et retourne vers le LiDAR; celui-ci peut alors estimer la distance à cet objet. Un balayage complet de la scène avec des faisceaux laser génère donc un grand ensemble de points 3D (ou nuage de points) représentant la structure de la scène. La figure de la page suivante montre un tel nuage de points tel que capté par un véhicule équipé d'un LiDAR; à notre qu'afin de faciliter la visualisation, les points utilisent un code de couleur basé sur la hauteur des points par rapport à la route. Une image de cette même scène telle que captée par une caméra est aussi montrée. As it can be seen, each object of the scene will be represented by several 3D points. These object's points should form a cluster. The objective of Part 1 of your programming assignment is therefore to run the DBSCAN algorithm on a LiDAR point cloud in order to detect the objects around the vehicle. Tel que vous pouvez le constater, chaque objet de la scène est représenté par plusieurs points 3D. Ces points appartenant à un objet devraient normalement créer un groupe. L'objectif de la Partie 1 de votre projet de programmation consiste donc à utiliser l'algorithme de DBSCAN afin d'identifier les objets autour du véhicule. Votre tâche You will receive 3 datasets, each containing the LiDAR point cloud for a particular scene. The points are listed in a CSV file, one point per line. x, y, z -5.057771786205823,-4.132708931956775,0.2428091883181846 -5.0355177525576,-4.088825974461278,0.241137471769056 -5.125807925277937,-4.136111826946676,0.2448524059120176 -5.079222136014556,-4.072855314440647,0.2420290529642492 CSI 2510 page 5 We ask you to use the DBSCAN algorithm in order to cluster the points of a LiDAR frame. At the end of the process, each cluster should correspond to a scene object. You have to select the specific parameter values of the DBSCANalgorithm that seems to produce the best results; but you have to use the same parameters for the three datasets. Your program takes as input the dataset filename and the value of the two DB-Scan parameters (eps, MinPts). As output, it produces a CSV file that will contain the point coordinates and corresponding cluster labels. An RGB color value, unique for each cluster, is also associated to each point; this color will be used to display the resulting clustered point cloud. Each RBG value is a number between 0.0 and 1.0. A display tool that reads this output file will be provided to you. x, y, z, C, R, G, B -5.057771786205823,-4.132708931956775,0.2428091883181846,1,1.0,0.0,0.0 -5.0355177525576,-4.088825974461278,0.241137471769056,1,1.0,0.0,0.0 -5.125807925277937, -4.136111826946676,0.2448524059120176,1,1.0,0.0,0.0 -5.079222136014556,-4.072855314440647,0.2420290529642492,2,1.0,0.5,0.0 Vous recevrez trois fichiers de données. Chacun de ces fichiers correspond à une capture LiDAR (une trame). Les points de cette trame sont listés dans un fichier CSV, avec un point par ligne. x, y, z -5.057771786205823,-4.132708931956775,0.2428091883181846 -5.0355177525576,-4.088825974461278,0.241137471769056 -5.125807925277937,-4.136111826946676,0.2448524059120176 -5.079222136014556,-4.072855314440647,0.2420290529642492 ... Nous vous demandons donc d'utiliser l'algorithme DBSCAN afin de grouper les points d'une trame LiDAR. A la fin du processus, chacun des groupes de points devraient correspondre à un objet de la scène. Vous devrez choisir la valeur des paramètres de l'algorithme DBCAN qui semble produire les meilleurs résultats; mais vous devez utiliser les mêmes paramètres pour les trois ensembles de données à traiter. Votre programme prendra en entrée le nom du fichier contenant les points ainsi que la valeur des deux paramètres de l'algorithme DBSCAN à utiliser. En sortie, votre programme doit produire un fichier CSV contenant la liste des points et l'étiquette du groupe auquel chaque point appartient. De plus, une couleur RGB sera associée à chaque étiquette; cette couleur sera utilisée afin de visualiser les points et leur groupe. Chaque valeur RGB est un nombre entre 0.0 et 1.0. Un outil de visualisation de nuage de points vous sera fourni. x, y, z, C, R, G, B -5.057771786205823,-4.132708931956775,0.2428091883181846,1,1.0,0.0,0.0 -5.0355177525576,-4.088825974461278,0.241137471769056,1,1.0,0.0,0.0 -5.125807925277937,-4.136111826946676,0.2448524059120176,1,1.0,0.0,0.0 -5.079222136014556,-4.072855314440647,0.2420290529642492,2,1.0,0.5,0.0 Programmation Your solution must include the following Java classes, attributes and methods: • The Point3D class that includes ○ getX, getY and getZ methods returning double public double getX() public double getY() • public double getZ () ○ a cluster label int a distance method that computes the Euclidean distance between two points public double distance (Point3D pt) The DBScan class that includes о a constructor that accepts a List of Point3D public DBScan (List<Point 3D>) ○ setEps and setMinPts methods о о public double setEps (double eps) public double setMinPts (double minPts) the findClusters method that executes the DBScan algorithm public void findClusters () a getNumberOfClusters method public int getNumberOfClusters () o a getPoints that returns the list of Point3D public List<Point3D> getPoints () CSI 2510 page 7 о the read static method that accept a filename and returns a list of Point3D • • ○ о public static List<point3D> read (String filename) the save method that saves all the points with their cluster label and associated RGB color public void save (String filename) Note that inside the DBScan algorithm, you must use a stack as indicated in the algorithm description A Stack class (to be used inside the DBScan algorithm) ○ with push and pop methods о you can use your implementation or the one in the Java API The NearestNeighbors class that includes о a constructor that accepts a List of Point3D Nearest Neighbors (List<Point 3D>) a rangeQuery method that finds the nearest neighbors of a 3D point public List<Point3D> rangeQuery (double eps) You can also create other classes and methods. Vous pouvez aussi créer d'autres classes ou méthodes. Warning: You will find on the Web, numerous implementations of the DBSCAN algorithm. You cannot use them! Do not even look at them! You have to program yourself the algorithm from scratch; not doing so will be considered plagiarism. The name of the output file must be the same than the one of the input file but to which you append the word 'clusters', the value of the parameters used and the number of clusters found using the format filename_clusters_eps_minPts_nclusters. For example, with the input file data.csv, the output file could be: data_clusters_1.2_10_57.csv Finally, running your program must be done by specifying the input filename, the parameters eps and minpts, exactly as follows: java DBScan data.csv 1.2 10 The parameter values shown are just an example, you can use other values. Before exiting, the program will save the output file and will display to the console the size of all clusters found, from the largest one to the smallest one. And the last value displayed is the number of noise points found. CSI 2510 page 8 Avertissement: Vous trouverez sur le Web de nombreuses versions de l'algorithme DBSCAN. Vous ne pouvez pas utiliser celles-ci! Ne les regardez même pas! Vous devez programmer vous-même l'algorithme à partir de rien. Utiliser ou s'inspirer d'une source externe sera considéré comme du plagiat. Le nom du fichier de sortie doit être le même que celui du fichier d'entrée mais en y ajoutant le mot 'clusters' et la valeur des paramètres utilisé ainsi que le nombre de groupes trouvée, en utilisant la convention filename_clusters_eps_minPts_nclusters. Par exemple pour le fichier data.csv, vous pourriez produire le fichier: data_clusters_1.2_10_57.csv Finalement, votre programme doit se lancer en spécifiant le nom du fichier de sortie ainsi que la valeur des paramètres eps et minpts. Ceci doit se faire exactement comme suit : java DBScan data.csv 1.2 10 Les valeurs de paramètres montrés sont simplement à titre d'exemple, vous pouvez utiliser d'autres valeurs. Avant de se terminer, votre programme sauvegarde le fichier de sortie et affiche à la console la taille des groupes trouvés du plus grand au plus petit. Et la dernière valeur affichée est le nombre de points 'outliers' trouvés. Grille de correction Correctness of the solution: 20% Quality of programming (structures, organisation, etc) 20% Quality of documentation (comments and headers) 20% Adherence to instructions (file format, required methods): 20% 20% Abstract data types and classes used: All your files must include a header that includes your name and student number. All the files must be submitted in a single zip file. Tous vos fichiers doivent inclure un entête incluant votre nom et numéro d'étudiant. Tous ces fichiers doivent être soumis dans un fichier zip. Description du problème In this programming assignment, you will implement a data clustering algorithm named DBSCAN - Density-Based Spatial Clustering of Applications with Noise. Given a large set of data points in a space of arbitrary dimension and given a distance metric, this algorithm can discover clusters of different shapes and sizes, marking as outliers isolated points in low-density regions (i.e. points whose nearest neighbors are too far away). The DBSCAN algorithm uses two parameters: • . minPts: The minimum number of points (a threshold) in the neighborhood of a point for this one to be considered to belong to a dense region. eps (ε): A distance measure that is used to identify the points in the neighborhood of any point. Cet exercice de programmation vous demande de programmer un algorithme de groupement de données appelé DBSCAN. Soit un ensemble de points dans un espace de dimension quelconque et soit une métrique de distance, cet algorithme permet de trouver les groupements de points de dimension et formes diverses tout en identifiant les points isolés n'appartement à aucun groupement (i.e. les points pour lesquels leurs plus proches voisins sont éloignés). L'algorithme DBSCAN utilise deux paramètres : • • minPts: le nombre minimum de voisins qu'un point doit avoir pour être considéré être dans une région dense. eps (E): la distance permettant d'identifier les points appartenant au voisinage d'un point donné. DBSCAN Algo: // DB contains the list of all points // label (P) of all P is initialized to undefined DBSCAN (DB, eps, minPts) C = 0 { for each point P in Sequence DB { if label (P) # undefined then continue Neighbors N = RangeQuery (DB, P, eps) if NminPts then { } label (P) = Noise continue C=C1 label (P) = C Stack S.push {N} while not S.empty() { Q = s.pop() if label (Q) = Noise then label (Q) = C if label (Q) undefined then continue label (Q) = C /* Cluster counter */ /* Already processed */ /* Find neighbors */ /* Density check */ /* Label as Noise */ /* next cluster label */ /* Label initial point */ /* Neighbors to expand */ /* Process point Q */ /* Noise becomes border pt */ /* Previously processed */ /* Label neighbor */ Neighbors N = RangeQuery (DB, Q, eps) /* Find neighbors */ if N minPts then { S.push{N} /* Density check */ /* Add neighbors to stack */ RangeQuery (DB, Q, eps) { Sequence N := empty list for each point P in Sequence DB { if distance (Q, P) ≤ eps then ( N.add(P) /* Scan all points in DB */ /* Compute distance */ /* Add to result */ } } return N } /* NOTE: S.push(N) means push all elements of list N into stack S */ /* Reference: https://en.wikipedia.org/wiki/DBSCAN */ Problème à résoudre The intelligent vehicles of the future will be equipped with a multitude of sensors in order to capture information about the surrounding scene and thus being able to autonomously navigate. One of these sensors is the Laser Scanner or LiDAR (Light Detection And Ranging). Using a LiDAR, the vehicle can scan the scene in front by sweeping few laser beams (typically between 8 to 64 lasers). Les véhicules intelligents du futur seront équipés d'une multitude de senseurs afin de capter l'information sur la scène qui les entourent de façon à pouvoir naviguer de manière autonome. L'un de ces senseurs est le Scanneur Laser, aussi appelé LiDAR. En utilisant un tel LiDAR, le véhicule peut examiner la scène devant lui par balayage de faisceaux laser (typiquement entre 8 et 64). T Laser beams LIDAR https://www.semanticscholar.org/paper/Ego-vehicle-localisation-using-LIDAR-and-compressed-Aronsson- Eriksson/010d3f269728a76ef62ead440541bc9481bc4a58 Each time a laser beam hit an object, the laser light bounce back to the LiDAR from which a precise distance can be estimated. A complete scan of the scene with these lasers will therefore generate a large set of 3D points (also called point cloud) that correspond to the structure of the scene. The figure on the next pageshows a typical point cloud captured by a car equipped with a LiDAR; note that to facilitate the visualization, the points are color-coded based on their height with respect to the ground. A view of the same scene captured by a camera is also shown. Chaque fois qu'un faisceau laser atteint un objet, la lumière laser rebondit et retourne vers le LiDAR; celui-ci peut alors estimer la distance à cet objet. Un balayage complet de la scène avec des faisceaux laser génère donc un grand ensemble de points 3D (ou nuage de points) représentant la structure de la scène. La figure de la page suivante montre un tel nuage de points tel que capté par un véhicule équipé d'un LiDAR; à notre qu'afin de faciliter la visualisation, les points utilisent un code de couleur basé sur la hauteur des points par rapport à la route. Une image de cette même scène telle que captée par une caméra est aussi montrée. As it can be seen, each object of the scene will be represented by several 3D points. These object's points should form a cluster. The objective of Part 1 of your programming assignment is therefore to run the DBSCAN algorithm on a LiDAR point cloud in order to detect the objects around the vehicle. Tel que vous pouvez le constater, chaque objet de la scène est représenté par plusieurs points 3D. Ces points appartenant à un objet devraient normalement créer un groupe. L'objectif de la Partie 1 de votre projet de programmation consiste donc à utiliser l'algorithme de DBSCAN afin d'identifier les objets autour du véhicule. Votre tâche You will receive 3 datasets, each containing the LiDAR point cloud for a particular scene. The points are listed in a CSV file, one point per line. x, y, z -5.057771786205823,-4.132708931956775,0.2428091883181846 -5.0355177525576,-4.088825974461278,0.241137471769056 -5.125807925277937,-4.136111826946676,0.2448524059120176 -5.079222136014556,-4.072855314440647,0.2420290529642492 CSI 2510 page 5 We ask you to use the DBSCAN algorithm in order to cluster the points of a LiDAR frame. At the end of the process, each cluster should correspond to a scene object. You have to select the specific parameter values of the DBSCANalgorithm that seems to produce the best results; but you have to use the same parameters for the three datasets. Your program takes as input the dataset filename and the value of the two DB-Scan parameters (eps, MinPts). As output, it produces a CSV file that will contain the point coordinates and corresponding cluster labels. An RGB color value, unique for each cluster, is also associated to each point; this color will be used to display the resulting clustered point cloud. Each RBG value is a number between 0.0 and 1.0. A display tool that reads this output file will be provided to you. x, y, z, C, R, G, B -5.057771786205823,-4.132708931956775,0.2428091883181846,1,1.0,0.0,0.0 -5.0355177525576,-4.088825974461278,0.241137471769056,1,1.0,0.0,0.0 -5.125807925277937, -4.136111826946676,0.2448524059120176,1,1.0,0.0,0.0 -5.079222136014556,-4.072855314440647,0.2420290529642492,2,1.0,0.5,0.0 Vous recevrez trois fichiers de données. Chacun de ces fichiers correspond à une capture LiDAR (une trame). Les points de cette trame sont listés dans un fichier CSV, avec un point par ligne. x, y, z -5.057771786205823,-4.132708931956775,0.2428091883181846 -5.0355177525576,-4.088825974461278,0.241137471769056 -5.125807925277937,-4.136111826946676,0.2448524059120176 -5.079222136014556,-4.072855314440647,0.2420290529642492 ... Nous vous demandons donc d'utiliser l'algorithme DBSCAN afin de grouper les points d'une trame LiDAR. A la fin du processus, chacun des groupes de points devraient correspondre à un objet de la scène. Vous devrez choisir la valeur des paramètres de l'algorithme DBCAN qui semble produire les meilleurs résultats; mais vous devez utiliser les mêmes paramètres pour les trois ensembles de données à traiter. Votre programme prendra en entrée le nom du fichier contenant les points ainsi que la valeur des deux paramètres de l'algorithme DBSCAN à utiliser. En sortie, votre programme doit produire un fichier CSV contenant la liste des points et l'étiquette du groupe auquel chaque point appartient. De plus, une couleur RGB sera associée à chaque étiquette; cette couleur sera utilisée afin de visualiser les points et leur groupe. Chaque valeur RGB est un nombre entre 0.0 et 1.0. Un outil de visualisation de nuage de points vous sera fourni. x, y, z, C, R, G, B -5.057771786205823,-4.132708931956775,0.2428091883181846,1,1.0,0.0,0.0 -5.0355177525576,-4.088825974461278,0.241137471769056,1,1.0,0.0,0.0 -5.125807925277937,-4.136111826946676,0.2448524059120176,1,1.0,0.0,0.0 -5.079222136014556,-4.072855314440647,0.2420290529642492,2,1.0,0.5,0.0 Programmation Your solution must include the following Java classes, attributes and methods: • The Point3D class that includes ○ getX, getY and getZ methods returning double public double getX() public double getY() • public double getZ () ○ a cluster label int a distance method that computes the Euclidean distance between two points public double distance (Point3D pt) The DBScan class that includes о a constructor that accepts a List of Point3D public DBScan (List<Point 3D>) ○ setEps and setMinPts methods о о public double setEps (double eps) public double setMinPts (double minPts) the findClusters method that executes the DBScan algorithm public void findClusters () a getNumberOfClusters method public int getNumberOfClusters () o a getPoints that returns the list of Point3D public List<Point3D> getPoints () CSI 2510 page 7 о the read static method that accept a filename and returns a list of Point3D • • ○ о public static List<point3D> read (String filename) the save method that saves all the points with their cluster label and associated RGB color public void save (String filename) Note that inside the DBScan algorithm, you must use a stack as indicated in the algorithm description A Stack class (to be used inside the DBScan algorithm) ○ with push and pop methods о you can use your implementation or the one in the Java API The NearestNeighbors class that includes о a constructor that accepts a List of Point3D Nearest Neighbors (List<Point 3D>) a rangeQuery method that finds the nearest neighbors of a 3D point public List<Point3D> rangeQuery (double eps) You can also create other classes and methods. Vous pouvez aussi créer d'autres classes ou méthodes. Warning: You will find on the Web, numerous implementations of the DBSCAN algorithm. You cannot use them! Do not even look at them! You have to program yourself the algorithm from scratch; not doing so will be considered plagiarism. The name of the output file must be the same than the one of the input file but to which you append the word 'clusters', the value of the parameters used and the number of clusters found using the format filename_clusters_eps_minPts_nclusters. For example, with the input file data.csv, the output file could be: data_clusters_1.2_10_57.csv Finally, running your program must be done by specifying the input filename, the parameters eps and minpts, exactly as follows: java DBScan data.csv 1.2 10 The parameter values shown are just an example, you can use other values. Before exiting, the program will save the output file and will display to the console the size of all clusters found, from the largest one to the smallest one. And the last value displayed is the number of noise points found. CSI 2510 page 8 Avertissement: Vous trouverez sur le Web de nombreuses versions de l'algorithme DBSCAN. Vous ne pouvez pas utiliser celles-ci! Ne les regardez même pas! Vous devez programmer vous-même l'algorithme à partir de rien. Utiliser ou s'inspirer d'une source externe sera considéré comme du plagiat. Le nom du fichier de sortie doit être le même que celui du fichier d'entrée mais en y ajoutant le mot 'clusters' et la valeur des paramètres utilisé ainsi que le nombre de groupes trouvée, en utilisant la convention filename_clusters_eps_minPts_nclusters. Par exemple pour le fichier data.csv, vous pourriez produire le fichier: data_clusters_1.2_10_57.csv Finalement, votre programme doit se lancer en spécifiant le nom du fichier de sortie ainsi que la valeur des paramètres eps et minpts. Ceci doit se faire exactement comme suit : java DBScan data.csv 1.2 10 Les valeurs de paramètres montrés sont simplement à titre d'exemple, vous pouvez utiliser d'autres valeurs. Avant de se terminer, votre programme sauvegarde le fichier de sortie et affiche à la console la taille des groupes trouvés du plus grand au plus petit. Et la dernière valeur affichée est le nombre de points 'outliers' trouvés. Grille de correction Correctness of the solution: 20% Quality of programming (structures, organisation, etc) 20% Quality of documentation (comments and headers) 20% Adherence to instructions (file format, required methods): 20% 20% Abstract data types and classes used: All your files must include a header that includes your name and student number. All the files must be submitted in a single zip file. Tous vos fichiers doivent inclure un entête incluant votre nom et numéro d'étudiant. Tous ces fichiers doivent être soumis dans un fichier zip. Description du problème In this programming assignment, you will implement a data clustering algorithm named DBSCAN - Density-Based Spatial Clustering of Applications with Noise. Given a large set of data points in a space of arbitrary dimension and given a distance metric, this algorithm can discover clusters of different shapes and sizes, marking as outliers isolated points in low-density regions (i.e. points whose nearest neighbors are too far away). The DBSCAN algorithm uses two parameters: • . minPts: The minimum number of points (a threshold) in the neighborhood of a point for this one to be considered to belong to a dense region. eps (ε): A distance measure that is used to identify the points in the neighborhood of any point. Cet exercice de programmation vous demande de programmer un algorithme de groupement de données appelé DBSCAN. Soit un ensemble de points dans un espace de dimension quelconque et soit une métrique de distance, cet algorithme permet de trouver les groupements de points de dimension et formes diverses tout en identifiant les points isolés n'appartement à aucun groupement (i.e. les points pour lesquels leurs plus proches voisins sont éloignés). L'algorithme DBSCAN utilise deux paramètres : • • minPts: le nombre minimum de voisins qu'un point doit avoir pour être considéré être dans une région dense. eps (E): la distance permettant d'identifier les points appartenant au voisinage d'un point donné. DBSCAN Algo: // DB contains the list of all points // label (P) of all P is initialized to undefined DBSCAN (DB, eps, minPts) C = 0 { for each point P in Sequence DB { if label (P) # undefined then continue Neighbors N = RangeQuery (DB, P, eps) if NminPts then { } label (P) = Noise continue C=C1 label (P) = C Stack S.push {N} while not S.empty() { Q = s.pop() if label (Q) = Noise then label (Q) = C if label (Q) undefined then continue label (Q) = C /* Cluster counter */ /* Already processed */ /* Find neighbors */ /* Density check */ /* Label as Noise */ /* next cluster label */ /* Label initial point */ /* Neighbors to expand */ /* Process point Q */ /* Noise becomes border pt */ /* Previously processed */ /* Label neighbor */ Neighbors N = RangeQuery (DB, Q, eps) /* Find neighbors */ if N minPts then { S.push{N} /* Density check */ /* Add neighbors to stack */ RangeQuery (DB, Q, eps) { Sequence N := empty list for each point P in Sequence DB { if distance (Q, P) ≤ eps then ( N.add(P) /* Scan all points in DB */ /* Compute distance */ /* Add to result */ } } return N } /* NOTE: S.push(N) means push all elements of list N into stack S */ /* Reference: https://en.wikipedia.org/wiki/DBSCAN */ Problème à résoudre The intelligent vehicles of the future will be equipped with a multitude of sensors in order to capture information about the surrounding scene and thus being able to autonomously navigate. One of these sensors is the Laser Scanner or LiDAR (Light Detection And Ranging). Using a LiDAR, the vehicle can scan the scene in front by sweeping few laser beams (typically between 8 to 64 lasers). Les véhicules intelligents du futur seront équipés d'une multitude de senseurs afin de capter l'information sur la scène qui les entourent de façon à pouvoir naviguer de manière autonome. L'un de ces senseurs est le Scanneur Laser, aussi appelé LiDAR. En utilisant un tel LiDAR, le véhicule peut examiner la scène devant lui par balayage de faisceaux laser (typiquement entre 8 et 64). T Laser beams LIDAR https://www.semanticscholar.org/paper/Ego-vehicle-localisation-using-LIDAR-and-compressed-Aronsson- Eriksson/010d3f269728a76ef62ead440541bc9481bc4a58 Each time a laser beam hit an object, the laser light bounce back to the LiDAR from which a precise distance can be estimated. A complete scan of the scene with these lasers will therefore generate a large set of 3D points (also called point cloud) that correspond to the structure of the scene. The figure on the next pageshows a typical point cloud captured by a car equipped with a LiDAR; note that to facilitate the visualization, the points are color-coded based on their height with respect to the ground. A view of the same scene captured by a camera is also shown. Chaque fois qu'un faisceau laser atteint un objet, la lumière laser rebondit et retourne vers le LiDAR; celui-ci peut alors estimer la distance à cet objet. Un balayage complet de la scène avec des faisceaux laser génère donc un grand ensemble de points 3D (ou nuage de points) représentant la structure de la scène. La figure de la page suivante montre un tel nuage de points tel que capté par un véhicule équipé d'un LiDAR; à notre qu'afin de faciliter la visualisation, les points utilisent un code de couleur basé sur la hauteur des points par rapport à la route. Une image de cette même scène telle que captée par une caméra est aussi montrée. As it can be seen, each object of the scene will be represented by several 3D points. These object's points should form a cluster. The objective of Part 1 of your programming assignment is therefore to run the DBSCAN algorithm on a LiDAR point cloud in order to detect the objects around the vehicle. Tel que vous pouvez le constater, chaque objet de la scène est représenté par plusieurs points 3D. Ces points appartenant à un objet devraient normalement créer un groupe. L'objectif de la Partie 1 de votre projet de programmation consiste donc à utiliser l'algorithme de DBSCAN afin d'identifier les objets autour du véhicule. Votre tâche You will receive 3 datasets, each containing the LiDAR point cloud for a particular scene. The points are listed in a CSV file, one point per line. x, y, z -5.057771786205823,-4.132708931956775,0.2428091883181846 -5.0355177525576,-4.088825974461278,0.241137471769056 -5.125807925277937,-4.136111826946676,0.2448524059120176 -5.079222136014556,-4.072855314440647,0.2420290529642492 CSI 2510 page 5 We ask you to use the DBSCAN algorithm in order to cluster the points of a LiDAR frame. At the end of the process, each cluster should correspond to a scene object. You have to select the specific parameter values of the DBSCANalgorithm that seems to produce the best results; but you have to use the same parameters for the three datasets. Your program takes as input the dataset filename and the value of the two DB-Scan parameters (eps, MinPts). As output, it produces a CSV file that will contain the point coordinates and corresponding cluster labels. An RGB color value, unique for each cluster, is also associated to each point; this color will be used to display the resulting clustered point cloud. Each RBG value is a number between 0.0 and 1.0. A display tool that reads this output file will be provided to you. x, y, z, C, R, G, B -5.057771786205823,-4.132708931956775,0.2428091883181846,1,1.0,0.0,0.0 -5.0355177525576,-4.088825974461278,0.241137471769056,1,1.0,0.0,0.0 -5.125807925277937, -4.136111826946676,0.2448524059120176,1,1.0,0.0,0.0 -5.079222136014556,-4.072855314440647,0.2420290529642492,2,1.0,0.5,0.0 Vous recevrez trois fichiers de données. Chacun de ces fichiers correspond à une capture LiDAR (une trame). Les points de cette trame sont listés dans un fichier CSV, avec un point par ligne. x, y, z -5.057771786205823,-4.132708931956775,0.2428091883181846 -5.0355177525576,-4.088825974461278,0.241137471769056 -5.125807925277937,-4.136111826946676,0.2448524059120176 -5.079222136014556,-4.072855314440647,0.2420290529642492 ... Nous vous demandons donc d'utiliser l'algorithme DBSCAN afin de grouper les points d'une trame LiDAR. A la fin du processus, chacun des groupes de points devraient correspondre à un objet de la scène. Vous devrez choisir la valeur des paramètres de l'algorithme DBCAN qui semble produire les meilleurs résultats; mais vous devez utiliser les mêmes paramètres pour les trois ensembles de données à traiter. Votre programme prendra en entrée le nom du fichier contenant les points ainsi que la valeur des deux paramètres de l'algorithme DBSCAN à utiliser. En sortie, votre programme doit produire un fichier CSV contenant la liste des points et l'étiquette du groupe auquel chaque point appartient. De plus, une couleur RGB sera associée à chaque étiquette; cette couleur sera utilisée afin de visualiser les points et leur groupe. Chaque valeur RGB est un nombre entre 0.0 et 1.0. Un outil de visualisation de nuage de points vous sera fourni. x, y, z, C, R, G, B -5.057771786205823,-4.132708931956775,0.2428091883181846,1,1.0,0.0,0.0 -5.0355177525576,-4.088825974461278,0.241137471769056,1,1.0,0.0,0.0 -5.125807925277937,-4.136111826946676,0.2448524059120176,1,1.0,0.0,0.0 -5.079222136014556,-4.072855314440647,0.2420290529642492,2,1.0,0.5,0.0 Programmation Your solution must include the following Java classes, attributes and methods: • The Point3D class that includes ○ getX, getY and getZ methods returning double public double getX() public double getY() • public double getZ () ○ a cluster label int a distance method that computes the Euclidean distance between two points public double distance (Point3D pt) The DBScan class that includes о a constructor that accepts a List of Point3D public DBScan (List<Point 3D>) ○ setEps and setMinPts methods о о public double setEps (double eps) public double setMinPts (double minPts) the findClusters method that executes the DBScan algorithm public void findClusters () a getNumberOfClusters method public int getNumberOfClusters () o a getPoints that returns the list of Point3D public List<Point3D> getPoints () CSI 2510 page 7 о the read static method that accept a filename and returns a list of Point3D • • ○ о public static List<point3D> read (String filename) the save method that saves all the points with their cluster label and associated RGB color public void save (String filename) Note that inside the DBScan algorithm, you must use a stack as indicated in the algorithm description A Stack class (to be used inside the DBScan algorithm) ○ with push and pop methods о you can use your implementation or the one in the Java API The NearestNeighbors class that includes о a constructor that accepts a List of Point3D Nearest Neighbors (List<Point 3D>) a rangeQuery method that finds the nearest neighbors of a 3D point public List<Point3D> rangeQuery (double eps) You can also create other classes and methods. Vous pouvez aussi créer d'autres classes ou méthodes. Warning: You will find on the Web, numerous implementations of the DBSCAN algorithm. You cannot use them! Do not even look at them! You have to program yourself the algorithm from scratch; not doing so will be considered plagiarism. The name of the output file must be the same than the one of the input file but to which you append the word 'clusters', the value of the parameters used and the number of clusters found using the format filename_clusters_eps_minPts_nclusters. For example, with the input file data.csv, the output file could be: data_clusters_1.2_10_57.csv Finally, running your program must be done by specifying the input filename, the parameters eps and minpts, exactly as follows: java DBScan data.csv 1.2 10 The parameter values shown are just an example, you can use other values. Before exiting, the program will save the output file and will display to the console the size of all clusters found, from the largest one to the smallest one. And the last value displayed is the number of noise points found. CSI 2510 page 8 Avertissement: Vous trouverez sur le Web de nombreuses versions de l'algorithme DBSCAN. Vous ne pouvez pas utiliser celles-ci! Ne les regardez même pas! Vous devez programmer vous-même l'algorithme à partir de rien. Utiliser ou s'inspirer d'une source externe sera considéré comme du plagiat. Le nom du fichier de sortie doit être le même que celui du fichier d'entrée mais en y ajoutant le mot 'clusters' et la valeur des paramètres utilisé ainsi que le nombre de groupes trouvée, en utilisant la convention filename_clusters_eps_minPts_nclusters. Par exemple pour le fichier data.csv, vous pourriez produire le fichier: data_clusters_1.2_10_57.csv Finalement, votre programme doit se lancer en spécifiant le nom du fichier de sortie ainsi que la valeur des paramètres eps et minpts. Ceci doit se faire exactement comme suit : java DBScan data.csv 1.2 10 Les valeurs de paramètres montrés sont simplement à titre d'exemple, vous pouvez utiliser d'autres valeurs. Avant de se terminer, votre programme sauvegarde le fichier de sortie et affiche à la console la taille des groupes trouvés du plus grand au plus petit. Et la dernière valeur affichée est le nombre de points 'outliers' trouvés. Grille de correction Correctness of the solution: 20% Quality of programming (structures, organisation, etc) 20% Quality of documentation (comments and headers) 20% Adherence to instructions (file format, required methods): 20% 20% Abstract data types and classes used: All your files must include a header that includes your name and student number. All the files must be submitted in a single zip file. Tous vos fichiers doivent inclure un entête incluant votre nom et numéro d'étudiant. Tous ces fichiers doivent être soumis dans un fichier zip. Description du problème In this programming assignment, you will implement a data clustering algorithm named DBSCAN - Density-Based Spatial Clustering of Applications with Noise. Given a large set of data points in a space of arbitrary dimension and given a distance metric, this algorithm can discover clusters of different shapes and sizes, marking as outliers isolated points in low-density regions (i.e. points whose nearest neighbors are too far away). The DBSCAN algorithm uses two parameters: • . minPts: The minimum number of points (a threshold) in the neighborhood of a point for this one to be considered to belong to a dense region. eps (ε): A distance measure that is used to identify the points in the neighborhood of any point. Cet exercice de programmation vous demande de programmer un algorithme de groupement de données appelé DBSCAN. Soit un ensemble de points dans un espace de dimension quelconque et soit une métrique de distance, cet algorithme permet de trouver les groupements de points de dimension et formes diverses tout en identifiant les points isolés n'appartement à aucun groupement (i.e. les points pour lesquels leurs plus proches voisins sont éloignés). L'algorithme DBSCAN utilise deux paramètres : • • minPts: le nombre minimum de voisins qu'un point doit avoir pour être considéré être dans une région dense. eps (E): la distance permettant d'identifier les points appartenant au voisinage d'un point donné. DBSCAN Algo: // DB contains the list of all points // label (P) of all P is initialized to undefined DBSCAN (DB, eps, minPts) C = 0 { for each point P in Sequence DB { if label (P) # undefined then continue Neighbors N = RangeQuery (DB, P, eps) if NminPts then { } label (P) = Noise continue C=C1 label (P) = C Stack S.push {N} while not S.empty() { Q = s.pop() if label (Q) = Noise then label (Q) = C if label (Q) undefined then continue label (Q) = C /* Cluster counter */ /* Already processed */ /* Find neighbors */ /* Density check */ /* Label as Noise */ /* next cluster label */ /* Label initial point */ /* Neighbors to expand */ /* Process point Q */ /* Noise becomes border pt */ /* Previously processed */ /* Label neighbor */ Neighbors N = RangeQuery (DB, Q, eps) /* Find neighbors */ if N minPts then { S.push{N} /* Density check */ /* Add neighbors to stack */ RangeQuery (DB, Q, eps) { Sequence N := empty list for each point P in Sequence DB { if distance (Q, P) ≤ eps then ( N.add(P) /* Scan all points in DB */ /* Compute distance */ /* Add to result */ } } return N } /* NOTE: S.push(N) means push all elements of list N into stack S */ /* Reference: https://en.wikipedia.org/wiki/DBSCAN */ Problème à résoudre The intelligent vehicles of the future will be equipped with a multitude of sensors in order to capture information about the surrounding scene and thus being able to autonomously navigate. One of these sensors is the Laser Scanner or LiDAR (Light Detection And Ranging). Using a LiDAR, the vehicle can scan the scene in front by sweeping few laser beams (typically between 8 to 64 lasers). Les véhicules intelligents du futur seront équipés d'une multitude de senseurs afin de capter l'information sur la scène qui les entourent de façon à pouvoir naviguer de manière autonome. L'un de ces senseurs est le Scanneur Laser, aussi appelé LiDAR. En utilisant un tel LiDAR, le véhicule peut examiner la scène devant lui par balayage de faisceaux laser (typiquement entre 8 et 64). T Laser beams LIDAR https://www.semanticscholar.org/paper/Ego-vehicle-localisation-using-LIDAR-and-compressed-Aronsson- Eriksson/010d3f269728a76ef62ead440541bc9481bc4a58 Each time a laser beam hit an object, the laser light bounce back to the LiDAR from which a precise distance can be estimated. A complete scan of the scene with these lasers will therefore generate a large set of 3D points (also called point cloud) that correspond to the structure of the scene. The figure on the next pageshows a typical point cloud captured by a car equipped with a LiDAR; note that to facilitate the visualization, the points are color-coded based on their height with respect to the ground. A view of the same scene captured by a camera is also shown. Chaque fois qu'un faisceau laser atteint un objet, la lumière laser rebondit et retourne vers le LiDAR; celui-ci peut alors estimer la distance à cet objet. Un balayage complet de la scène avec des faisceaux laser génère donc un grand ensemble de points 3D (ou nuage de points) représentant la structure de la scène. La figure de la page suivante montre un tel nuage de points tel que capté par un véhicule équipé d'un LiDAR; à notre qu'afin de faciliter la visualisation, les points utilisent un code de couleur basé sur la hauteur des points par rapport à la route. Une image de cette même scène telle que captée par une caméra est aussi montrée. As it can be seen, each object of the scene will be represented by several 3D points. These object's points should form a cluster. The objective of Part 1 of your programming assignment is therefore to run the DBSCAN algorithm on a LiDAR point cloud in order to detect the objects around the vehicle. Tel que vous pouvez le constater, chaque objet de la scène est représenté par plusieurs points 3D. Ces points appartenant à un objet devraient normalement créer un groupe. L'objectif de la Partie 1 de votre projet de programmation consiste donc à utiliser l'algorithme de DBSCAN afin d'identifier les objets autour du véhicule. Votre tâche You will receive 3 datasets, each containing the LiDAR point cloud for a particular scene. The points are listed in a CSV file, one point per line. x, y, z -5.057771786205823,-4.132708931956775,0.2428091883181846 -5.0355177525576,-4.088825974461278,0.241137471769056 -5.125807925277937,-4.136111826946676,0.2448524059120176 -5.079222136014556,-4.072855314440647,0.2420290529642492 CSI 2510 page 5 We ask you to use the DBSCAN algorithm in order to cluster the points of a LiDAR frame. At the end of the process, each cluster should correspond to a scene object. You have to select the specific parameter values of the DBSCANalgorithm that seems to produce the best results; but you have to use the same parameters for the three datasets. Your program takes as input the dataset filename and the value of the two DB-Scan parameters (eps, MinPts). As output, it produces a CSV file that will contain the point coordinates and corresponding cluster labels. An RGB color value, unique for each cluster, is also associated to each point; this color will be used to display the resulting clustered point cloud. Each RBG value is a number between 0.0 and 1.0. A display tool that reads this output file will be provided to you. x, y, z, C, R, G, B -5.057771786205823,-4.132708931956775,0.2428091883181846,1,1.0,0.0,0.0 -5.0355177525576,-4.088825974461278,0.241137471769056,1,1.0,0.0,0.0 -5.125807925277937, -4.136111826946676,0.2448524059120176,1,1.0,0.0,0.0 -5.079222136014556,-4.072855314440647,0.2420290529642492,2,1.0,0.5,0.0 Vous recevrez trois fichiers de données. Chacun de ces fichiers correspond à une capture LiDAR (une trame). Les points de cette trame sont listés dans un fichier CSV, avec un point par ligne. x, y, z -5.057771786205823,-4.132708931956775,0.2428091883181846 -5.0355177525576,-4.088825974461278,0.241137471769056 -5.125807925277937,-4.136111826946676,0.2448524059120176 -5.079222136014556,-4.072855314440647,0.2420290529642492 ... Nous vous demandons donc d'utiliser l'algorithme DBSCAN afin de grouper les points d'une trame LiDAR. A la fin du processus, chacun des groupes de points devraient correspondre à un objet de la scène. Vous devrez choisir la valeur des paramètres de l'algorithme DBCAN qui semble produire les meilleurs résultats; mais vous devez utiliser les mêmes paramètres pour les trois ensembles de données à traiter. Votre programme prendra en entrée le nom du fichier contenant les points ainsi que la valeur des deux paramètres de l'algorithme DBSCAN à utiliser. En sortie, votre programme doit produire un fichier CSV contenant la liste des points et l'étiquette du groupe auquel chaque point appartient. De plus, une couleur RGB sera associée à chaque étiquette; cette couleur sera utilisée afin de visualiser les points et leur groupe. Chaque valeur RGB est un nombre entre 0.0 et 1.0. Un outil de visualisation de nuage de points vous sera fourni. x, y, z, C, R, G, B -5.057771786205823,-4.132708931956775,0.2428091883181846,1,1.0,0.0,0.0 -5.0355177525576,-4.088825974461278,0.241137471769056,1,1.0,0.0,0.0 -5.125807925277937,-4.136111826946676,0.2448524059120176,1,1.0,0.0,0.0 -5.079222136014556,-4.072855314440647,0.2420290529642492,2,1.0,0.5,0.0 Programmation Your solution must include the following Java classes, attributes and methods: • The Point3D class that includes ○ getX, getY and getZ methods returning double public double getX() public double getY() • public double getZ () ○ a cluster label int a distance method that computes the Euclidean distance between two points public double distance (Point3D pt) The DBScan class that includes о a constructor that accepts a List of Point3D public DBScan (List<Point 3D>) ○ setEps and setMinPts methods о о public double setEps (double eps) public double setMinPts (double minPts) the findClusters method that executes the DBScan algorithm public void findClusters () a getNumberOfClusters method public int getNumberOfClusters () o a getPoints that returns the list of Point3D public List<Point3D> getPoints () CSI 2510 page 7 о the read static method that accept a filename and returns a list of Point3D • • ○ о public static List<point3D> read (String filename) the save method that saves all the points with their cluster label and associated RGB color public void save (String filename) Note that inside the DBScan algorithm, you must use a stack as indicated in the algorithm description A Stack class (to be used inside the DBScan algorithm) ○ with push and pop methods о you can use your implementation or the one in the Java API The NearestNeighbors class that includes о a constructor that accepts a List of Point3D Nearest Neighbors (List<Point 3D>) a rangeQuery method that finds the nearest neighbors of a 3D point public List<Point3D> rangeQuery (double eps) You can also create other classes and methods. Vous pouvez aussi créer d'autres classes ou méthodes. Warning: You will find on the Web, numerous implementations of the DBSCAN algorithm. You cannot use them! Do not even look at them! You have to program yourself the algorithm from scratch; not doing so will be considered plagiarism. The name of the output file must be the same than the one of the input file but to which you append the word 'clusters', the value of the parameters used and the number of clusters found using the format filename_clusters_eps_minPts_nclusters. For example, with the input file data.csv, the output file could be: data_clusters_1.2_10_57.csv Finally, running your program must be done by specifying the input filename, the parameters eps and minpts, exactly as follows: java DBScan data.csv 1.2 10 The parameter values shown are just an example, you can use other values. Before exiting, the program will save the output file and will display to the console the size of all clusters found, from the largest one to the smallest one. And the last value displayed is the number of noise points found. CSI 2510 page 8 Avertissement: Vous trouverez sur le Web de nombreuses versions de l'algorithme DBSCAN. Vous ne pouvez pas utiliser celles-ci! Ne les regardez même pas! Vous devez programmer vous-même l'algorithme à partir de rien. Utiliser ou s'inspirer d'une source externe sera considéré comme du plagiat. Le nom du fichier de sortie doit être le même que celui du fichier d'entrée mais en y ajoutant le mot 'clusters' et la valeur des paramètres utilisé ainsi que le nombre de groupes trouvée, en utilisant la convention filename_clusters_eps_minPts_nclusters. Par exemple pour le fichier data.csv, vous pourriez produire le fichier: data_clusters_1.2_10_57.csv Finalement, votre programme doit se lancer en spécifiant le nom du fichier de sortie ainsi que la valeur des paramètres eps et minpts. Ceci doit se faire exactement comme suit : java DBScan data.csv 1.2 10 Les valeurs de paramètres montrés sont simplement à titre d'exemple, vous pouvez utiliser d'autres valeurs. Avant de se terminer, votre programme sauvegarde le fichier de sortie et affiche à la console la taille des groupes trouvés du plus grand au plus petit. Et la dernière valeur affichée est le nombre de points 'outliers' trouvés. Grille de correction Correctness of the solution: 20% Quality of programming (structures, organisation, etc) 20% Quality of documentation (comments and headers) 20% Adherence to instructions (file format, required methods): 20% 20% Abstract data types and classes used: All your files must include a header that includes your name and student number. All the files must be submitted in a single zip file. Tous vos fichiers doivent inclure un entête incluant votre nom et numéro d'étudiant. Tous ces fichiers doivent être soumis dans un fichier zip. Description du problème In this programming assignment, you will implement a data clustering algorithm named DBSCAN - Density-Based Spatial Clustering of Applications with Noise. Given a large set of data points in a space of arbitrary dimension and given a distance metric, this algorithm can discover clusters of different shapes and sizes, marking as outliers isolated points in low-density regions (i.e. points whose nearest neighbors are too far away). The DBSCAN algorithm uses two parameters: • . minPts: The minimum number of points (a threshold) in the neighborhood of a point for this one to be considered to belong to a dense region. eps (ε): A distance measure that is used to identify the points in the neighborhood of any point. Cet exercice de programmation vous demande de programmer un algorithme de groupement de données appelé DBSCAN. Soit un ensemble de points dans un espace de dimension quelconque et soit une métrique de distance, cet algorithme permet de trouver les groupements de points de dimension et formes diverses tout en identifiant les points isolés n'appartement à aucun groupement (i.e. les points pour lesquels leurs plus proches voisins sont éloignés). L'algorithme DBSCAN utilise deux paramètres : • • minPts: le nombre minimum de voisins qu'un point doit avoir pour être considéré être dans une région dense. eps (E): la distance permettant d'identifier les points appartenant au voisinage d'un point donné. DBSCAN Algo: // DB contains the list of all points // label (P) of all P is initialized to undefined DBSCAN (DB, eps, minPts) C = 0 { for each point P in Sequence DB { if label (P) # undefined then continue Neighbors N = RangeQuery (DB, P, eps) if NminPts then { } label (P) = Noise continue C=C1 label (P) = C Stack S.push {N} while not S.empty() { Q = s.pop() if label (Q) = Noise then label (Q) = C if label (Q) undefined then continue label (Q) = C /* Cluster counter */ /* Already processed */ /* Find neighbors */ /* Density check */ /* Label as Noise */ /* next cluster label */ /* Label initial point */ /* Neighbors to expand */ /* Process point Q */ /* Noise becomes border pt */ /* Previously processed */ /* Label neighbor */ Neighbors N = RangeQuery (DB, Q, eps) /* Find neighbors */ if N minPts then { S.push{N} /* Density check */ /* Add neighbors to stack */ RangeQuery (DB, Q, eps) { Sequence N := empty list for each point P in Sequence DB { if distance (Q, P) ≤ eps then ( N.add(P) /* Scan all points in DB */ /* Compute distance */ /* Add to result */ } } return N } /* NOTE: S.push(N) means push all elements of list N into stack S */ /* Reference: https://en.wikipedia.org/wiki/DBSCAN */ Problème à résoudre The intelligent vehicles of the future will be equipped with a multitude of sensors in order to capture information about the surrounding scene and thus being able to autonomously navigate. One of these sensors is the Laser Scanner or LiDAR (Light Detection And Ranging). Using a LiDAR, the vehicle can scan the scene in front by sweeping few laser beams (typically between 8 to 64 lasers). Les véhicules intelligents du futur seront équipés d'une multitude de senseurs afin de capter l'information sur la scène qui les entourent de façon à pouvoir naviguer de manière autonome. L'un de ces senseurs est le Scanneur Laser, aussi appelé LiDAR. En utilisant un tel LiDAR, le véhicule peut examiner la scène devant lui par balayage de faisceaux laser (typiquement entre 8 et 64). T Laser beams LIDAR https://www.semanticscholar.org/paper/Ego-vehicle-localisation-using-LIDAR-and-compressed-Aronsson- Eriksson/010d3f269728a76ef62ead440541bc9481bc4a58 Each time a laser beam hit an object, the laser light bounce back to the LiDAR from which a precise distance can be estimated. A complete scan of the scene with these lasers will therefore generate a large set of 3D points (also called point cloud) that correspond to the structure of the scene. The figure on the next pageshows a typical point cloud captured by a car equipped with a LiDAR; note that to facilitate the visualization, the points are color-coded based on their height with respect to the ground. A view of the same scene captured by a camera is also shown. Chaque fois qu'un faisceau laser atteint un objet, la lumière laser rebondit et retourne vers le LiDAR; celui-ci peut alors estimer la distance à cet objet. Un balayage complet de la scène avec des faisceaux laser génère donc un grand ensemble de points 3D (ou nuage de points) représentant la structure de la scène. La figure de la page suivante montre un tel nuage de points tel que capté par un véhicule équipé d'un LiDAR; à notre qu'afin de faciliter la visualisation, les points utilisent un code de couleur basé sur la hauteur des points par rapport à la route. Une image de cette même scène telle que captée par une caméra est aussi montrée. As it can be seen, each object of the scene will be represented by several 3D points. These object's points should form a cluster. The objective of Part 1 of your programming assignment is therefore to run the DBSCAN algorithm on a LiDAR point cloud in order to detect the objects around the vehicle. Tel que vous pouvez le constater, chaque objet de la scène est représenté par plusieurs points 3D. Ces points appartenant à un objet devraient normalement créer un groupe. L'objectif de la Partie 1 de votre projet de programmation consiste donc à utiliser l'algorithme de DBSCAN afin d'identifier les objets autour du véhicule. Votre tâche You will receive 3 datasets, each containing the LiDAR point cloud for a particular scene. The points are listed in a CSV file, one point per line. x, y, z -5.057771786205823,-4.132708931956775,0.2428091883181846 -5.0355177525576,-4.088825974461278,0.241137471769056 -5.125807925277937,-4.136111826946676,0.2448524059120176 -5.079222136014556,-4.072855314440647,0.2420290529642492 CSI 2510 page 5 We ask you to use the DBSCAN algorithm in order to cluster the points of a LiDAR frame. At the end of the process, each cluster should correspond to a scene object. You have to select the specific parameter values of the DBSCANalgorithm that seems to produce the best results; but you have to use the same parameters for the three datasets. Your program takes as input the dataset filename and the value of the two DB-Scan parameters (eps, MinPts). As output, it produces a CSV file that will contain the point coordinates and corresponding cluster labels. An RGB color value, unique for each cluster, is also associated to each point; this color will be used to display the resulting clustered point cloud. Each RBG value is a number between 0.0 and 1.0. A display tool that reads this output file will be provided to you. x, y, z, C, R, G, B -5.057771786205823,-4.132708931956775,0.2428091883181846,1,1.0,0.0,0.0 -5.0355177525576,-4.088825974461278,0.241137471769056,1,1.0,0.0,0.0 -5.125807925277937, -4.136111826946676,0.2448524059120176,1,1.0,0.0,0.0 -5.079222136014556,-4.072855314440647,0.2420290529642492,2,1.0,0.5,0.0 Vous recevrez trois fichiers de données. Chacun de ces fichiers correspond à une capture LiDAR (une trame). Les points de cette trame sont listés dans un fichier CSV, avec un point par ligne. x, y, z -5.057771786205823,-4.132708931956775,0.2428091883181846 -5.0355177525576,-4.088825974461278,0.241137471769056 -5.125807925277937,-4.136111826946676,0.2448524059120176 -5.079222136014556,-4.072855314440647,0.2420290529642492 ... Nous vous demandons donc d'utiliser l'algorithme DBSCAN afin de grouper les points d'une trame LiDAR. A la fin du processus, chacun des groupes de points devraient correspondre à un objet de la scène. Vous devrez choisir la valeur des paramètres de l'algorithme DBCAN qui semble produire les meilleurs résultats; mais vous devez utiliser les mêmes paramètres pour les trois ensembles de données à traiter. Votre programme prendra en entrée le nom du fichier contenant les points ainsi que la valeur des deux paramètres de l'algorithme DBSCAN à utiliser. En sortie, votre programme doit produire un fichier CSV contenant la liste des points et l'étiquette du groupe auquel chaque point appartient. De plus, une couleur RGB sera associée à chaque étiquette; cette couleur sera utilisée afin de visualiser les points et leur groupe. Chaque valeur RGB est un nombre entre 0.0 et 1.0. Un outil de visualisation de nuage de points vous sera fourni. x, y, z, C, R, G, B -5.057771786205823,-4.132708931956775,0.2428091883181846,1,1.0,0.0,0.0 -5.0355177525576,-4.088825974461278,0.241137471769056,1,1.0,0.0,0.0 -5.125807925277937,-4.136111826946676,0.2448524059120176,1,1.0,0.0,0.0 -5.079222136014556,-4.072855314440647,0.2420290529642492,2,1.0,0.5,0.0 Programmation Your solution must include the following Java classes, attributes and methods: • The Point3D class that includes ○ getX, getY and getZ methods returning double public double getX() public double getY() • public double getZ () ○ a cluster label int a distance method that computes the Euclidean distance between two points public double distance (Point3D pt) The DBScan class that includes о a constructor that accepts a List of Point3D public DBScan (List<Point 3D>) ○ setEps and setMinPts methods о о public double setEps (double eps) public double setMinPts (double minPts) the findClusters method that executes the DBScan algorithm public void findClusters () a getNumberOfClusters method public int getNumberOfClusters () o a getPoints that returns the list of Point3D public List<Point3D> getPoints () CSI 2510 page 7 о the read static method that accept a filename and returns a list of Point3D • • ○ о public static List<point3D> read (String filename) the save method that saves all the points with their cluster label and associated RGB color public void save (String filename) Note that inside the DBScan algorithm, you must use a stack as indicated in the algorithm description A Stack class (to be used inside the DBScan algorithm) ○ with push and pop methods о you can use your implementation or the one in the Java API The NearestNeighbors class that includes о a constructor that accepts a List of Point3D Nearest Neighbors (List<Point 3D>) a rangeQuery method that finds the nearest neighbors of a 3D point public List<Point3D> rangeQuery (double eps) You can also create other classes and methods. Vous pouvez aussi créer d'autres classes ou méthodes. Warning: You will find on the Web, numerous implementations of the DBSCAN algorithm. You cannot use them! Do not even look at them! You have to program yourself the algorithm from scratch; not doing so will be considered plagiarism. The name of the output file must be the same than the one of the input file but to which you append the word 'clusters', the value of the parameters used and the number of clusters found using the format filename_clusters_eps_minPts_nclusters. For example, with the input file data.csv, the output file could be: data_clusters_1.2_10_57.csv Finally, running your program must be done by specifying the input filename, the parameters eps and minpts, exactly as follows: java DBScan data.csv 1.2 10 The parameter values shown are just an example, you can use other values. Before exiting, the program will save the output file and will display to the console the size of all clusters found, from the largest one to the smallest one. And the last value displayed is the number of noise points found. CSI 2510 page 8 Avertissement: Vous trouverez sur le Web de nombreuses versions de l'algorithme DBSCAN. Vous ne pouvez pas utiliser celles-ci! Ne les regardez même pas! Vous devez programmer vous-même l'algorithme à partir de rien. Utiliser ou s'inspirer d'une source externe sera considéré comme du plagiat. Le nom du fichier de sortie doit être le même que celui du fichier d'entrée mais en y ajoutant le mot 'clusters' et la valeur des paramètres utilisé ainsi que le nombre de groupes trouvée, en utilisant la convention filename_clusters_eps_minPts_nclusters. Par exemple pour le fichier data.csv, vous pourriez produire le fichier: data_clusters_1.2_10_57.csv Finalement, votre programme doit se lancer en spécifiant le nom du fichier de sortie ainsi que la valeur des paramètres eps et minpts. Ceci doit se faire exactement comme suit : java DBScan data.csv 1.2 10 Les valeurs de paramètres montrés sont simplement à titre d'exemple, vous pouvez utiliser d'autres valeurs. Avant de se terminer, votre programme sauvegarde le fichier de sortie et affiche à la console la taille des groupes trouvés du plus grand au plus petit. Et la dernière valeur affichée est le nombre de points 'outliers' trouvés. Grille de correction Correctness of the solution: 20% Quality of programming (structures, organisation, etc) 20% Quality of documentation (comments and headers) 20% Adherence to instructions (file format, required methods): 20% 20% Abstract data types and classes used: All your files must include a header that includes your name and student number. All the files must be submitted in a single zip file. Tous vos fichiers doivent inclure un entête incluant votre nom et numéro d'étudiant. Tous ces fichiers doivent être soumis dans un fichier zip. Description du problème In this programming assignment, you will implement a data clustering algorithm named DBSCAN - Density-Based Spatial Clustering of Applications with Noise. Given a large set of data points in a space of arbitrary dimension and given a distance metric, this algorithm can discover clusters of different shapes and sizes, marking as outliers isolated points in low-density regions (i.e. points whose nearest neighbors are too far away). The DBSCAN algorithm uses two parameters: • . minPts: The minimum number of points (a threshold) in the neighborhood of a point for this one to be considered to belong to a dense region. eps (ε): A distance measure that is used to identify the points in the neighborhood of any point. Cet exercice de programmation vous demande de programmer un algorithme de groupement de données appelé DBSCAN. Soit un ensemble de points dans un espace de dimension quelconque et soit une métrique de distance, cet algorithme permet de trouver les groupements de points de dimension et formes diverses tout en identifiant les points isolés n'appartement à aucun groupement (i.e. les points pour lesquels leurs plus proches voisins sont éloignés). L'algorithme DBSCAN utilise deux paramètres : • • minPts: le nombre minimum de voisins qu'un point doit avoir pour être considéré être dans une région dense. eps (E): la distance permettant d'identifier les points appartenant au voisinage d'un point donné. DBSCAN Algo: // DB contains the list of all points // label (P) of all P is initialized to undefined DBSCAN (DB, eps, minPts) C = 0 { for each point P in Sequence DB { if label (P) # undefined then continue Neighbors N = RangeQuery (DB, P, eps) if NminPts then { } label (P) = Noise continue C=C1 label (P) = C Stack S.push {N} while not S.empty() { Q = s.pop() if label (Q) = Noise then label (Q) = C if label (Q) undefined then continue label (Q) = C /* Cluster counter */ /* Already processed */ /* Find neighbors */ /* Density check */ /* Label as Noise */ /* next cluster label */ /* Label initial point */ /* Neighbors to expand */ /* Process point Q */ /* Noise becomes border pt */ /* Previously processed */ /* Label neighbor */ Neighbors N = RangeQuery (DB, Q, eps) /* Find neighbors */ if N minPts then { S.push{N} /* Density check */ /* Add neighbors to stack */ RangeQuery (DB, Q, eps) { Sequence N := empty list for each point P in Sequence DB { if distance (Q, P) ≤ eps then ( N.add(P) /* Scan all points in DB */ /* Compute distance */ /* Add to result */ } } return N } /* NOTE: S.push(N) means push all elements of list N into stack S */ /* Reference: https://en.wikipedia.org/wiki/DBSCAN */ Problème à résoudre The intelligent vehicles of the future will be equipped with a multitude of sensors in order to capture information about the surrounding scene and thus being able to autonomously navigate. One of these sensors is the Laser Scanner or LiDAR (Light Detection And Ranging). Using a LiDAR, the vehicle can scan the scene in front by sweeping few laser beams (typically between 8 to 64 lasers). Les véhicules intelligents du futur seront équipés d'une multitude de senseurs afin de capter l'information sur la scène qui les entourent de façon à pouvoir naviguer de manière autonome. L'un de ces senseurs est le Scanneur Laser, aussi appelé LiDAR. En utilisant un tel LiDAR, le véhicule peut examiner la scène devant lui par balayage de faisceaux laser (typiquement entre 8 et 64). T Laser beams LIDAR https://www.semanticscholar.org/paper/Ego-vehicle-localisation-using-LIDAR-and-compressed-Aronsson- Eriksson/010d3f269728a76ef62ead440541bc9481bc4a58 Each time a laser beam hit an object, the laser light bounce back to the LiDAR from which a precise distance can be estimated. A complete scan of the scene with these lasers will therefore generate a large set of 3D points (also called point cloud) that correspond to the structure of the scene. The figure on the next pageshows a typical point cloud captured by a car equipped with a LiDAR; note that to facilitate the visualization, the points are color-coded based on their height with respect to the ground. A view of the same scene captured by a camera is also shown. Chaque fois qu'un faisceau laser atteint un objet, la lumière laser rebondit et retourne vers le LiDAR; celui-ci peut alors estimer la distance à cet objet. Un balayage complet de la scène avec des faisceaux laser génère donc un grand ensemble de points 3D (ou nuage de points) représentant la structure de la scène. La figure de la page suivante montre un tel nuage de points tel que capté par un véhicule équipé d'un LiDAR; à notre qu'afin de faciliter la visualisation, les points utilisent un code de couleur basé sur la hauteur des points par rapport à la route. Une image de cette même scène telle que captée par une caméra est aussi montrée. As it can be seen, each object of the scene will be represented by several 3D points. These object's points should form a cluster. The objective of Part 1 of your programming assignment is therefore to run the DBSCAN algorithm on a LiDAR point cloud in order to detect the objects around the vehicle. Tel que vous pouvez le constater, chaque objet de la scène est représenté par plusieurs points 3D. Ces points appartenant à un objet devraient normalement créer un groupe. L'objectif de la Partie 1 de votre projet de programmation consiste donc à utiliser l'algorithme de DBSCAN afin d'identifier les objets autour du véhicule. Votre tâche You will receive 3 datasets, each containing the LiDAR point cloud for a particular scene. The points are listed in a CSV file, one point per line. x, y, z -5.057771786205823,-4.132708931956775,0.2428091883181846 -5.0355177525576,-4.088825974461278,0.241137471769056 -5.125807925277937,-4.136111826946676,0.2448524059120176 -5.079222136014556,-4.072855314440647,0.2420290529642492 CSI 2510 page 5 We ask you to use the DBSCAN algorithm in order to cluster the points of a LiDAR frame. At the end of the process, each cluster should correspond to a scene object. You have to select the specific parameter values of the DBSCANalgorithm that seems to produce the best results; but you have to use the same parameters for the three datasets. Your program takes as input the dataset filename and the value of the two DB-Scan parameters (eps, MinPts). As output, it produces a CSV file that will contain the point coordinates and corresponding cluster labels. An RGB color value, unique for each cluster, is also associated to each point; this color will be used to display the resulting clustered point cloud. Each RBG value is a number between 0.0 and 1.0. A display tool that reads this output file will be provided to you. x, y, z, C, R, G, B -5.057771786205823,-4.132708931956775,0.2428091883181846,1,1.0,0.0,0.0 -5.0355177525576,-4.088825974461278,0.241137471769056,1,1.0,0.0,0.0 -5.125807925277937, -4.136111826946676,0.2448524059120176,1,1.0,0.0,0.0 -5.079222136014556,-4.072855314440647,0.2420290529642492,2,1.0,0.5,0.0 Vous recevrez trois fichiers de données. Chacun de ces fichiers correspond à une capture LiDAR (une trame). Les points de cette trame sont listés dans un fichier CSV, avec un point par ligne. x, y, z -5.057771786205823,-4.132708931956775,0.2428091883181846 -5.0355177525576,-4.088825974461278,0.241137471769056 -5.125807925277937,-4.136111826946676,0.2448524059120176 -5.079222136014556,-4.072855314440647,0.2420290529642492 ... Nous vous demandons donc d'utiliser l'algorithme DBSCAN afin de grouper les points d'une trame LiDAR. A la fin du processus, chacun des groupes de points devraient correspondre à un objet de la scène. Vous devrez choisir la valeur des paramètres de l'algorithme DBCAN qui semble produire les meilleurs résultats; mais vous devez utiliser les mêmes paramètres pour les trois ensembles de données à traiter. Votre programme prendra en entrée le nom du fichier contenant les points ainsi que la valeur des deux paramètres de l'algorithme DBSCAN à utiliser. En sortie, votre programme doit produire un fichier CSV contenant la liste des points et l'étiquette du groupe auquel chaque point appartient. De plus, une couleur RGB sera associée à chaque étiquette; cette couleur sera utilisée afin de visualiser les points et leur groupe. Chaque valeur RGB est un nombre entre 0.0 et 1.0. Un outil de visualisation de nuage de points vous sera fourni. x, y, z, C, R, G, B -5.057771786205823,-4.132708931956775,0.2428091883181846,1,1.0,0.0,0.0 -5.0355177525576,-4.088825974461278,0.241137471769056,1,1.0,0.0,0.0 -5.125807925277937,-4.136111826946676,0.2448524059120176,1,1.0,0.0,0.0 -5.079222136014556,-4.072855314440647,0.2420290529642492,2,1.0,0.5,0.0 Programmation Your solution must include the following Java classes, attributes and methods: • The Point3D class that includes ○ getX, getY and getZ methods returning double public double getX() public double getY() • public double getZ () ○ a cluster label int a distance method that computes the Euclidean distance between two points public double distance (Point3D pt) The DBScan class that includes о a constructor that accepts a List of Point3D public DBScan (List<Point 3D>) ○ setEps and setMinPts methods о о public double setEps (double eps) public double setMinPts (double minPts) the findClusters method that executes the DBScan algorithm public void findClusters () a getNumberOfClusters method public int getNumberOfClusters () o a getPoints that returns the list of Point3D public List<Point3D> getPoints () CSI 2510 page 7 о the read static method that accept a filename and returns a list of Point3D • • ○ о public static List<point3D> read (String filename) the save method that saves all the points with their cluster label and associated RGB color public void save (String filename) Note that inside the DBScan algorithm, you must use a stack as indicated in the algorithm description A Stack class (to be used inside the DBScan algorithm) ○ with push and pop methods о you can use your implementation or the one in the Java API The NearestNeighbors class that includes о a constructor that accepts a List of Point3D Nearest Neighbors (List<Point 3D>) a rangeQuery method that finds the nearest neighbors of a 3D point public List<Point3D> rangeQuery (double eps) You can also create other classes and methods. Vous pouvez aussi créer d'autres classes ou méthodes. Warning: You will find on the Web, numerous implementations of the DBSCAN algorithm. You cannot use them! Do not even look at them! You have to program yourself the algorithm from scratch; not doing so will be considered plagiarism. The name of the output file must be the same than the one of the input file but to which you append the word 'clusters', the value of the parameters used and the number of clusters found using the format filename_clusters_eps_minPts_nclusters. For example, with the input file data.csv, the output file could be: data_clusters_1.2_10_57.csv Finally, running your program must be done by specifying the input filename, the parameters eps and minpts, exactly as follows: java DBScan data.csv 1.2 10 The parameter values shown are just an example, you can use other values. Before exiting, the program will save the output file and will display to the console the size of all clusters found, from the largest one to the smallest one. And the last value displayed is the number of noise points found. CSI 2510 page 8 Avertissement: Vous trouverez sur le Web de nombreuses versions de l'algorithme DBSCAN. Vous ne pouvez pas utiliser celles-ci! Ne les regardez même pas! Vous devez programmer vous-même l'algorithme à partir de rien. Utiliser ou s'inspirer d'une source externe sera considéré comme du plagiat. Le nom du fichier de sortie doit être le même que celui du fichier d'entrée mais en y ajoutant le mot 'clusters' et la valeur des paramètres utilisé ainsi que le nombre de groupes trouvée, en utilisant la convention filename_clusters_eps_minPts_nclusters. Par exemple pour le fichier data.csv, vous pourriez produire le fichier: data_clusters_1.2_10_57.csv Finalement, votre programme doit se lancer en spécifiant le nom du fichier de sortie ainsi que la valeur des paramètres eps et minpts. Ceci doit se faire exactement comme suit : java DBScan data.csv 1.2 10 Les valeurs de paramètres montrés sont simplement à titre d'exemple, vous pouvez utiliser d'autres valeurs. Avant de se terminer, votre programme sauvegarde le fichier de sortie et affiche à la console la taille des groupes trouvés du plus grand au plus petit. Et la dernière valeur affichée est le nombre de points 'outliers' trouvés. Grille de correction Correctness of the solution: 20% Quality of programming (structures, organisation, etc) 20% Quality of documentation (comments and headers) 20% Adherence to instructions (file format, required methods): 20% 20% Abstract data types and classes used: All your files must include a header that includes your name and student number. All the files must be submitted in a single zip file. Tous vos fichiers doivent inclure un entête incluant votre nom et numéro d'étudiant. Tous ces fichiers doivent être soumis dans un fichier zip.
Expert Answer:
Answer rating: 100% (QA)
Heres the implementation of the DBSCAN algorithm Implement the Point3D class with attributes for xy and z coordinates a cluster label and a distance method that computes the Euclidean distance between ... View the full answer

Related Book For 
Posted Date:
Students also viewed these programming questions
-
1. Discuss aggregate planning and the different planning levels. 2. What is the relationship between inventory management and the supply chain? 3. Why is there a need to balance the inventory needs...
-
Assignment 5: Hash Table implementation andconcordance There are three parts to this assignment. In the first two parts,you will complete the implementation of a hash map and aconcordance program. In...
-
In this programming assignment you will practice using ArrayLists, Inheritance and Polymorphism. You are to write a game called Magical Creatures War. You will do this by implementing a class called...
-
HL Co. uses the high-low method to derive a total cost formula. Using a range of units produced from 1,500 to 7,500, and a range of total costs from $21,000 to $45,000, producing 2,000 units will...
-
What are the experimental units on which each of the following responses are observed? a. College GPA b. Household income c. Gasoline mileage rating for an automobile model d. Number of defective...
-
An electron is released from rest at x = 2 m in the potential shown in Figure Q26.6. Does it move? If so, to the left or to the right? Explain. V (V) 100- -x (m) 2. -100 - FIGURE Q26.6
-
You would expect to find that lessees, in general, are in relatively low income-tax brackets, while lessors tend to be in high tax brackets. The reason for this is that owning tends to provide tax...
-
1. Use the background information to develop a business profile for Personal Trainer. Be sure to indicate where more information will be needed. 2. Each new supercenter service represents a business...
-
please show work/steps clearly Evaluate the given limits. Exercise 1. [1 mark] x - 7 lim x-7 X Exercise 2. [3 marks] 2x2 - x - 15 lim x-+3 x2 - 9 Exercise 3. [3 marks] 1+ - lim x--1 1+x-8- -6 ( - 2,...
-
It is early April 2021 and you, CPA, work in a mid-sized accounting firm in Regina, Saskatchewan. While you normally work on audits, you have requested to participate in the personal tax pool this...
-
Complete ratio analysis for the years 2010 through 2014, calculating the following ratios Use the unaudited data for 2014. For any ratios that use an average of 2 years in the formula, you can assume...
-
Discuss the concept of Expected Rate of Return. Think about the expected rate of return in terms of stocks and discuss stand-alone risk, market conditions. What is the probability of each of these...
-
A rotating light is located 17 feet from a wall. The light completes one rotation every 4 seconds. Find the rate at which the light projected onto the wall is moving along the wall when the light's...
-
Selecting one private bank and one government bank in the PHilippines.(BPI AND LAND BANK) Then, comparing and contrasting (similarities and differences) its vision, mission, goals, objectives,...
-
What is the FV of a 3-year $100 annuity, if the quoted interest rate is 10%, compounded semiannually? Please show the calculations in detail for Financial calculator
-
Data foran art supplies companyfor the yearare as follows: Finished goods inventory, beginning balance $300,000 Work-in-process inventory, endingbalance 215,000 Underapplied manufacturing overhead...
-
Lock & Key Inc. began operations on January 1, 2019. Its post-closing trial balance at December 31, 2019 and 2020, is shown below along with some other information. Lock & Key Inc. Income Statement...
-
Suppose the S&P 500 futures price is 1000, = 30%, r = 5%, = 5%, T = 1, and n = 3. a. What are the prices of European calls and puts for K = $1000? Why do you find the prices to be equal? b. What...
-
Write a program that reads a number and prints all of its binary digits: Print the remainder number % 2, then replace the number with number / 2. Keep going until the number is 0. For example, if the...
-
Give the Java code for constructing an object of class Rectangle, and for declaring an object variable of class Rectangle.
-
Suppose you are stranded on a desert island on which stacks are plentiful, but you need a queue. How can you implement a queue using two stacks? What is the big-Oh running time of the queue...
-
The September 3, 2009, issue of BusinessWeek includes an article by Lindsey Gerdes entitled The Best Places to Launch a Career. It provides interesting information regarding the job opportunities for...
-
Presented below are selected financial statement items for Rowe Corporation for December 31, 2012. Inventory $ 55,000 Cash paid to purchase equipment $ 30,000 Cash paid to suppliers 154,000 Equipment...
-
Purpose: Identify summary information about companies. This information includes basic descriptions of the companys location, activities, industry, financial health, and financial performance....

Study smarter with the SolutionInn App