Description Runte PLC is a (fictitious) multinational supermarket chain headquartered in Hertfordshire, England. It is the nth largest retailer in the world measured by profits.
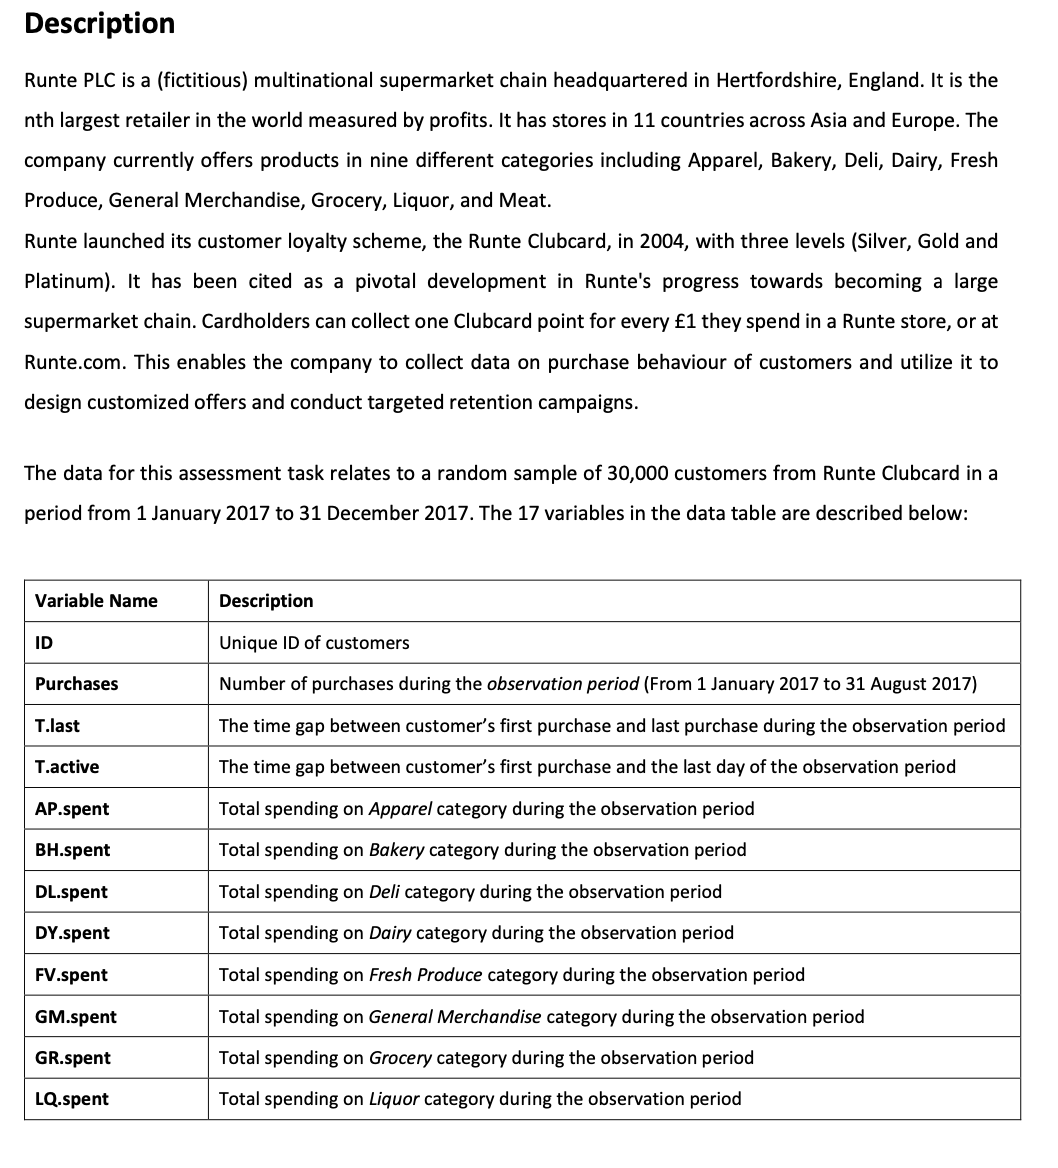
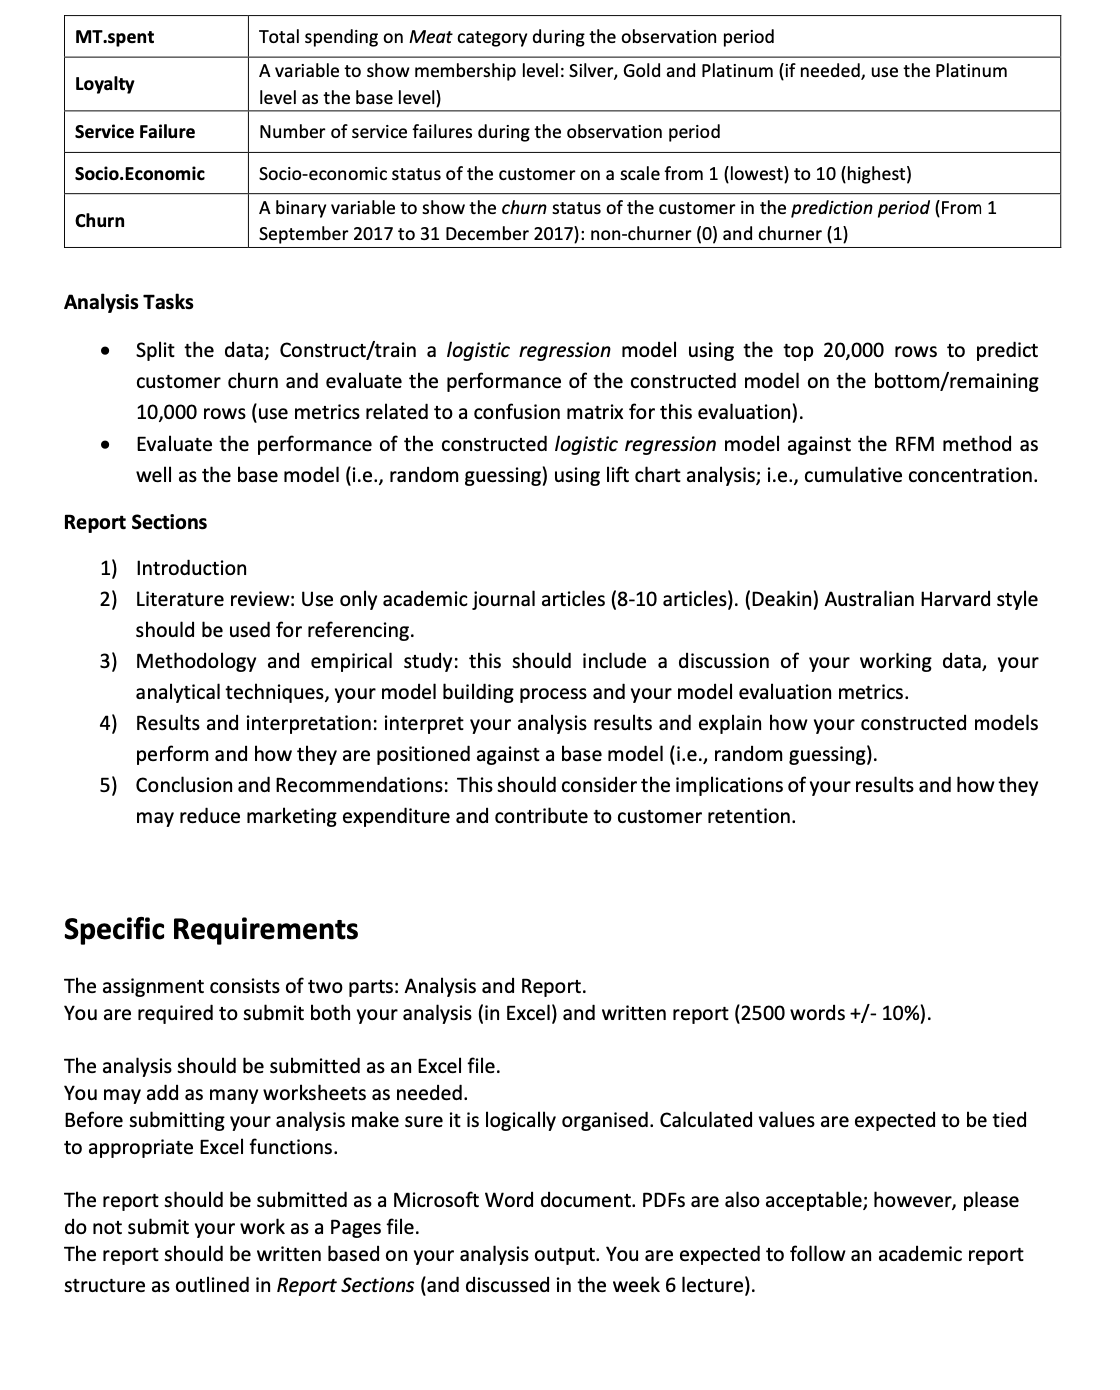
Description Runte PLC is a (fictitious) multinational supermarket chain headquartered in Hertfordshire, England. It is the nth largest retailer in the world measured by profits. It has stores in 11 countries across Asia and Europe. The company currently offers products in nine different categories including Apparel, Bakery, Deli, Dairy, Fresh Produce, General Merchandise, Grocery, Liquor, and Meat. Runte launched its customer loyalty scheme, the Runte Clubcard, in 2004, with three levels (Silver, Gold and Platinum). It has been cited as a pivotal development in Runte's progress towards becoming a large supermarket chain. Cardholders can collect one Clubcard point for every 1 they spend in a Runte store, or at Runte.com. This enables the company to collect data on purchase behaviour of customers and utilize it to design customized offers and conduct targeted retention campaigns. The data for this assessment task relates to a random sample of 30,000 customers from Runte Clubcard in a period from 1 January 2017 to 31 December 2017. The 17 variables in the data table are described below: Variable Name Description ID Unique ID of customers Purchases Number of purchases during the observation period [From 1 January 2017 to 31 August 2017] T.last The time gap between customer's first purchase and last purchase during the observation period T.active The time gap between customer's first purchase and the last day of the observation period AP.spent Total spending on Apparel category during the observation period BH.spent Total spending on Bakery category during the observation period DL.spent Total spending on Deir' category during the observation period DY.spent Total spending on Dairy category during the observation period FV.spent Total spending on Fresh Produce category during the observation period GM.spent Total spending on General Merchandise category during the observation period GR.spent Total spending on Grocery category during the observation period LQspe at Total spending on Liquor category during the observation period MT.spent Total spending on Meet category during the observation period Lo alt? A variable to show membership level: Silver, Gold and Platinum (if needed, use the Platinum V level as the base level] Service Failure Number of service failures during the observation period Socio.Economic Socio-economic status of the customer on a scale from 1 [lowest] to 10 [highest] Churn A binary variable to show the churn status of the customer in the prediction period (From 1 September 2017 to 31 December 2017]: non-churner (0] and churner (1] Analysis Tasks Split the data; Construct/train a iogistic regression model using the top 20,000 rows to predict customer churn and evaluate the performance of the constructed model on the bottom/remaining 10,000 rows (use metrics related to a confusion matrix for this evaluation]. Evaluate the performance of the constructed iogistic regression model against the RFM method as well as the base model (i.e., random guessing] using lift chart analysis; i.e., cumulative concentration. Report Sections 1) 2) Introduction Literature review: Use only academic journal articles (8-10 articles]. (Deakin) Australian Harvard style should be used for referencing. Methodology and empirical study: this should include a discussion of your working data, your analytical techniques, your model building process and your model evaluation metrics. Results and interpretation: interpret your analysis results and explain how your constructed models perform and how they are positioned against a base model (i.e., random guessing]. Conclusion and Recommendations: This should consider the implications of your results and how they may reduce marketing expenditure and contribute to customer retention. Specific Requirements The assignment consists of two parts: Analysis and Report. You are required to submit both your analysis (in Excel] and written report (2500 words +/- 10%]. The analysis should be submitted as an Excel file. You may add as many worksheets as needed. Before submitting your analysis make sure it is logically organised. Calculated values are expected to be tied to appropriate Excel functions. The report should be submitted as a Microsoft Word document. PDFs are also acceptable; however, please do not submit your work as a Pages file. The report should be written based on your analysis output. You are expected to follow an academic report structure as outlined in Report Sections (and discussed in the week 6 lecture]
Step by Step Solution
There are 3 Steps involved in it
Step: 1
Get Instant Access to Expert-Tailored Solutions
See step-by-step solutions with expert insights and AI powered tools for academic success
Step: 2
Step: 3
Ace Your Homework with AI
Get the answers you need in no time with our AI-driven, step-by-step assistance