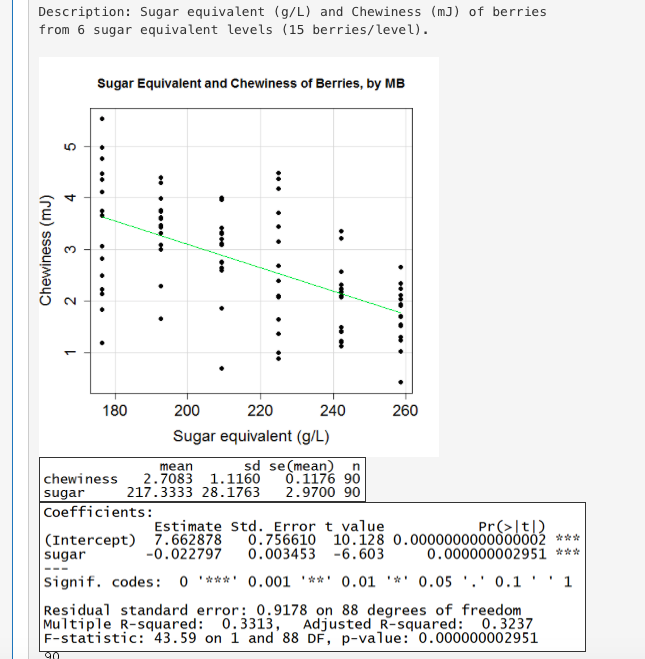
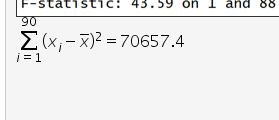
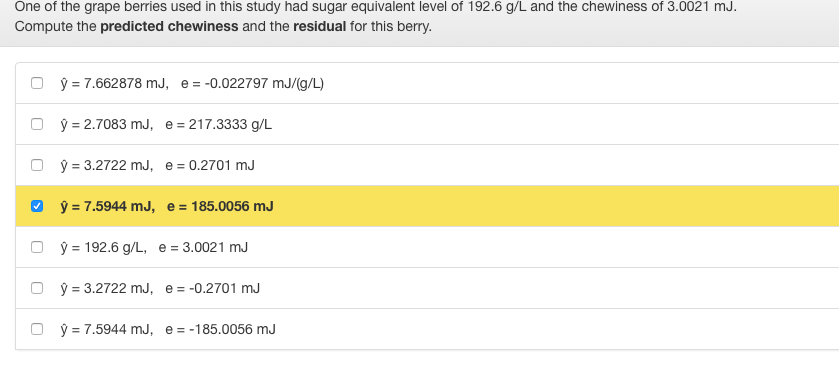
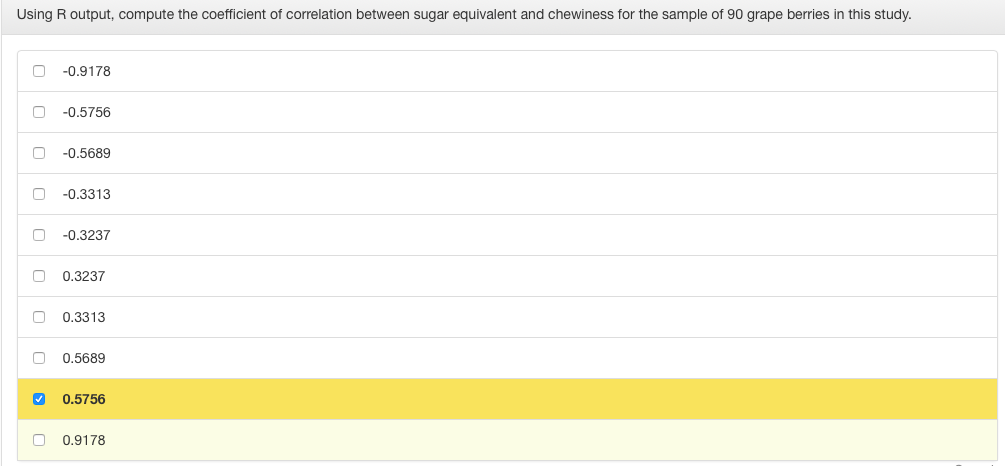
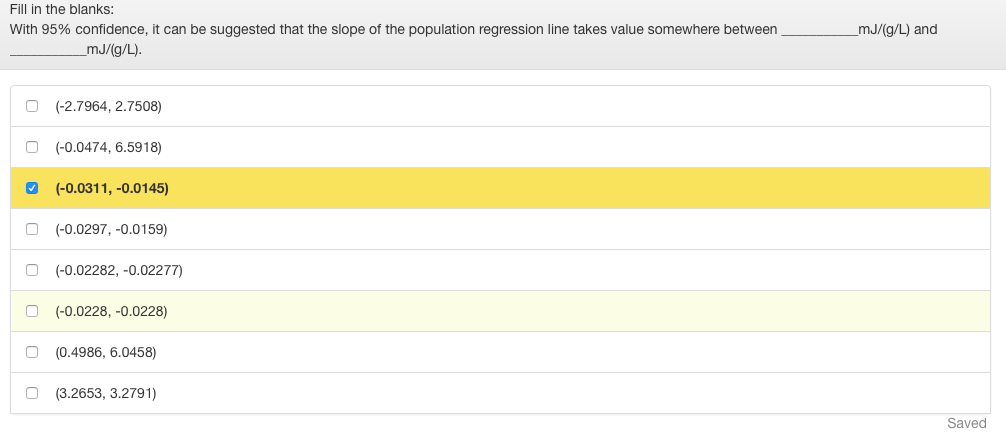
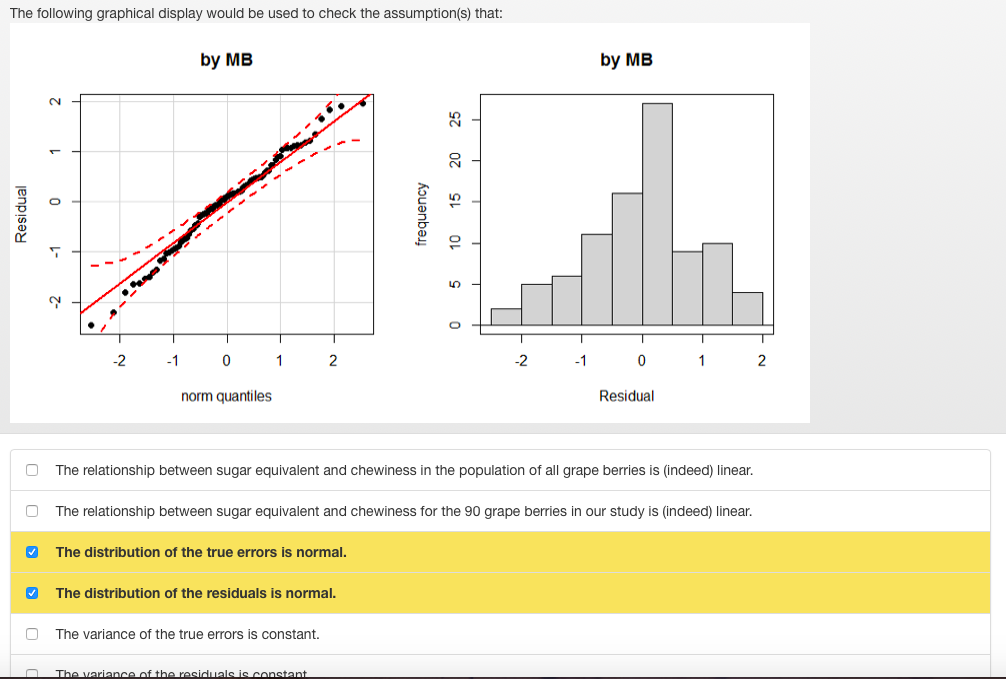
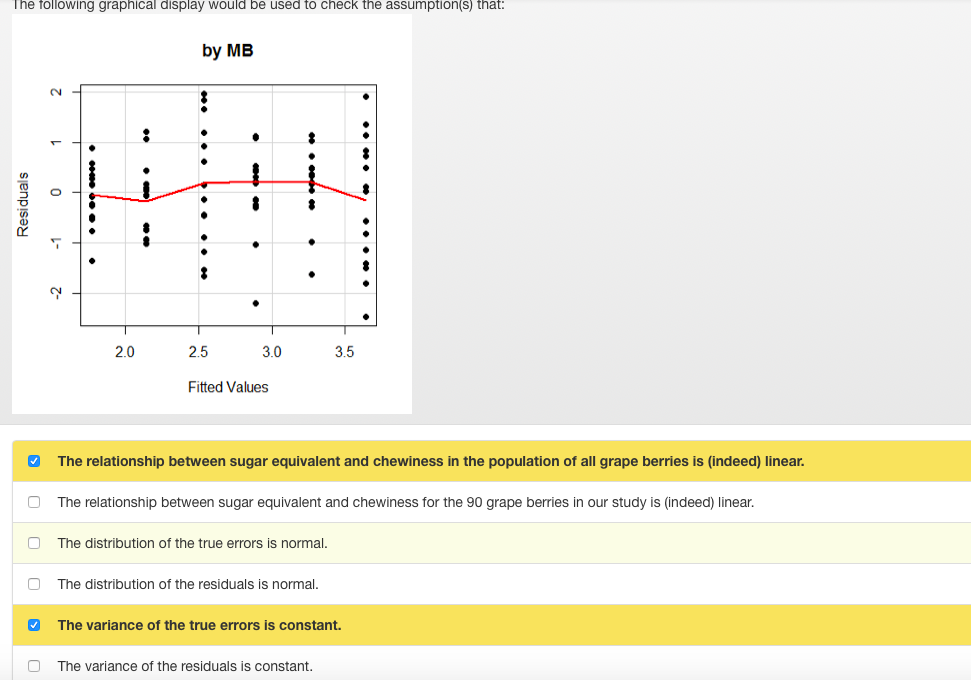
Description: Sugar equivalent (9/L) and Chewiness (m]) of berries from 6 sugar equivalent levels (15 berries/level). Sugar Equivalent and Chewiness of Berries, by MB Chewiness (mJ) . .. .. . . . . .. 180 200 220 240 260 Sugar equivalent (g/L) chewiness mean 2. 7083 1. 1160 sd se (mean) n 0. 1176 90 sugar 217.3333 28.1763 2.9700 90 Coefficients: (Intercept) Estimate Std. Error t value 7. 662878 pr(> It/) 0. 022797 0. 756610 10.128 0. 0000000000000002 * * * sugar 0. 003453 -6.603 0 . 000000002951 * * * Signif. codes: 0 '*** ' 0.001 '#* ' 0.01 '*' 0.05 . . ' 0.1 . . Residual standard error: 0.9178 on 88 degrees of freedom Multiple R-squared: 0. 3313, Adjusted R-squared: 0. 3237 F-statistic: 43.59 on 1 and 88 DF, p-value: 0. 000000002951\fOne of the grape berries used in this study had sugar equivalent level of 192.6 g/L and the chewiness of 3.0021 mJ. Compute the predicted chewiness and the residual for this berry. O y = 7.662878 mJ, e= -0.022797 mJ/(g/L) O y = 2.7083 mJ, e = 217.3333 g/L O y = 3.2722 mJ, e = 0.2701 mJ y = 7.5944 mJ, e = 185.0056 mJ D y = 192.6 g/L, e = 3.0021 mJ O y= 3.2722 mJ, e= -0.2701 mJ O y = 7.5944 mJ, e= -185.0056 mJWould it be appropriate to use our sample least square regression line for predicting the chewiness of a grape berry with sugar equivalent of 300 g/L? Answer Yes or No and Explain. O Yes, because the predicted value y = 0.823778 mJ is within the range of chewiness values that we see on our scatterplot. O No, because in order to make such prediction we would need to know the population least squares regression line. O Yes, because prediction is just a point on the regression line, and the line does not stop, so prediction can be calculated for any value of sugar equivalent, including 300 g/L. No, because 300 g/L is outside of the available range of sugar equivalent values, and we don't know whether the linear relationship between sugar equivalent and chewiness is preserved outside the range of values that we see on our scatterplot. Making such prediction would be called extrapolation. SavedUsing R output, compute the coefficient of correlation between sugar equivalent and chewiness for the sample of 90 grape berries in this study. O -0.9178 O -0.5756 0 -0.5689 O -0.3313 O -0.3237 0 0.3237 0 0.3313 0 0.5689 0.5756 0 0.9178\fThe following graphical display would be used to check the assumption(s) that: by MB by MB Residual O frequency LO O -2 -1 0 1 2 -2 -1 0 2 norm quantiles Residual O The relationship between sugar equivalent and chewiness in the population of all grape berries is (indeed) linear. The relationship between sugar equivalent and chewiness for the 90 grape berries in our study is (indeed) linear. The distribution of the true errors is normal. The distribution of the residuals is normal. The variance of the true errors is constant.The following graphical display would be used to check the assumption(s) that: by MB Residuals ... 2.0 2.5 3.0 3.5 Fitted Values The relationship between sugar equivalent and chewiness in the population of all grape berries is (indeed) linear. O The relationship between sugar equivalent and chewiness for the 90 grape berries in our study is (indeed) linear. O The distribution of the true errors is normal. O The distribution of the residuals is normal. The variance of the true errors is constant. O The variance of the residuals is constant
