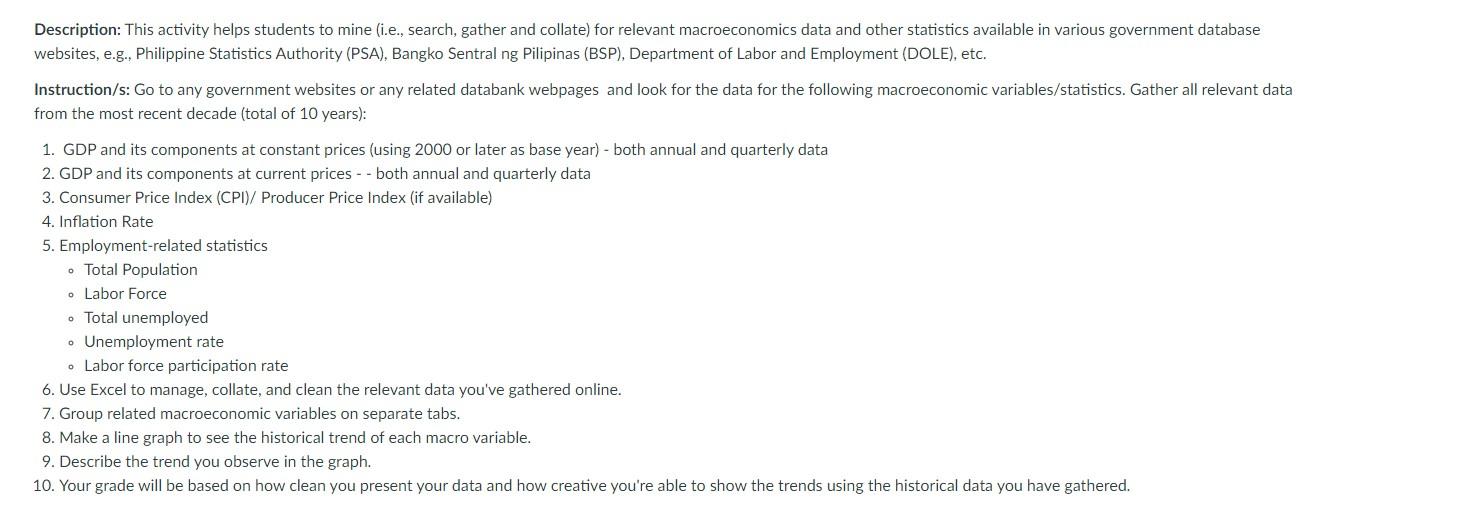
Description: This activity helps students to mine (i.e., search, gather and collate) for relevant macroeconomics data and other statistics available in various government database websites, e.g., Philippine Statistics Authority (PSA), Bangko Sentral ng Pilipinas (BSP), Department of Labor and Employment (DOLE), etc. Instruction/s: Go to any government websites or any related databank webpages and look for the data for the following macroeconomic variables/statistics. Gather all relevant data from the most recent decade (total of 10 years): 1. GDP and its components at constant prices (using 2000 or later as base year) - both annual and quarterly data 2. GDP and its components at current prices - - both annual and quarterly data 3. Consumer Price Index (CPI)/ Producer Price Index (if available) 4. Inflation Rate 5. Employment-related statistics - Total Population - Labor Force - Total unemployed - Unemployment rate - Labor force participation rate 6. Use Excel to manage, collate, and clean the relevant data you've gathered online. 7. Group related macroeconomic variables on separate tabs. 8. Make a line graph to see the historical trend of each macro variable. 9. Describe the trend you observe in the graph. 10. Your grade will be based on how clean you present your data and how creative you're able to show the trends using the historical data you have gathered. Description: This activity helps students to mine (i.e., search, gather and collate) for relevant macroeconomics data and other statistics available in various government database websites, e.g., Philippine Statistics Authority (PSA), Bangko Sentral ng Pilipinas (BSP), Department of Labor and Employment (DOLE), etc. Instruction/s: Go to any government websites or any related databank webpages and look for the data for the following macroeconomic variables/statistics. Gather all relevant data from the most recent decade (total of 10 years): 1. GDP and its components at constant prices (using 2000 or later as base year) - both annual and quarterly data 2. GDP and its components at current prices - - both annual and quarterly data 3. Consumer Price Index (CPI)/ Producer Price Index (if available) 4. Inflation Rate 5. Employment-related statistics - Total Population - Labor Force - Total unemployed - Unemployment rate - Labor force participation rate 6. Use Excel to manage, collate, and clean the relevant data you've gathered online. 7. Group related macroeconomic variables on separate tabs. 8. Make a line graph to see the historical trend of each macro variable. 9. Describe the trend you observe in the graph. 10. Your grade will be based on how clean you present your data and how creative you're able to show the trends using the historical data you have gathered


