

Answered step by step
Verified Expert Solution
Question
1 Approved Answer
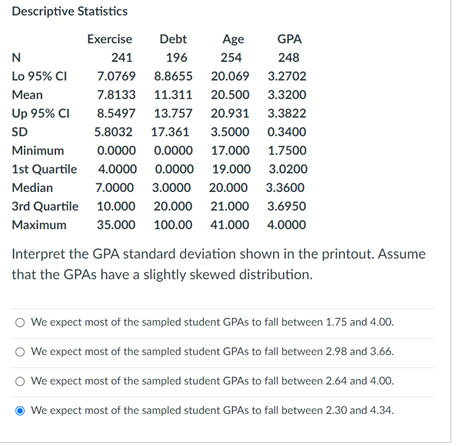
Descriptive Statistics Exercise Debt Age GPA N 241 196 254 248 Lo 95% CI 7.0769 8.8655 20.069 3.2702 Mean 7.8133 11.311 20.500 3.3200 Up 95%
Step by Step Solution
There are 3 Steps involved in it
Step: 1

Get Instant Access to Expert-Tailored Solutions
See step-by-step solutions with expert insights and AI powered tools for academic success
Step: 2

Step: 3
Ace Your Homework with AI
Get the answers you need in no time with our AI-driven, step-by-step assistance
Get Started
Intermediate Algebra With Trigonometry
Authors: Charles P McKeague
1st Edition
1483218759, 9781483218755