Question: Design and implement an application that creates a histogram that allows you to visually inspect the frequency distribution of a set of values. The program
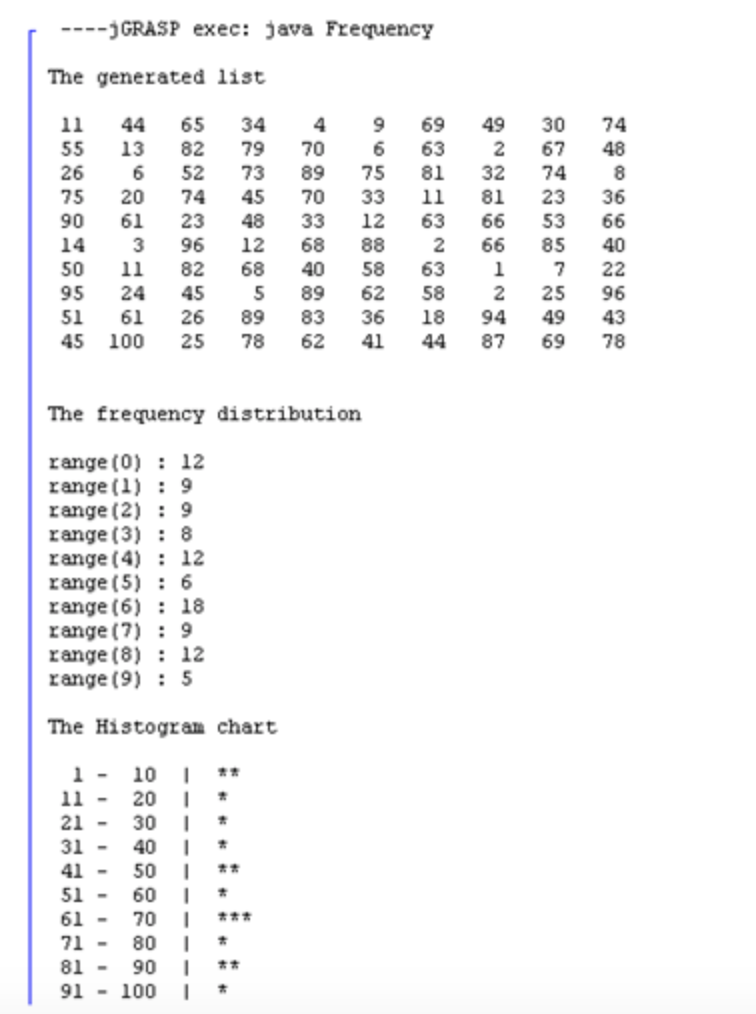
Design and implement an application that creates a histogram that allows you to visually inspect the frequency distribution of a set of values. The program should generate an arbitrary number of integers that are in range 1 to 100 inclusive; then produce a chart similar to the one below that indicates how many input values fell in range 1 to 10, 11 to 20, and so on. Print one asterisk for every five values in each category. Ignore leftovers. For example, if a category had 17 values, print three asterisks in that row. If a category had 4 values, do not print any asterisks in that row.

GRASP exec: Java Frequency The generated list 11 44 65 34 49 69 49 30 74 55 13 82 79 70663 2 6748 6 52 73 89 75 81 32 74 8 75 20 74 45 7033 11 81 23 36 90 61 23 48 33 12 63 66 53 66 2 66 85 40 7 22 96 51 61 26 89 83 36 18 94 49 43 45 100 25 78 62 4 44 87 69 78 26 3 96 12 68 88 1 50 11 82 68 40 5863 95 24 4S 5 89 62 58 225 The frequency distribution range (0): 12 range (1): 9 range (2) 9 range (3) 8 range (4): 12 range (5): 6 range (6)18 range(7):9 range (8) 12 range(9) : 5 The Histogran chart 1-10s 11 20 1- 30 3140 1-50 51-60 6170 71- 80 81 90 1100
Step by Step Solution
There are 3 Steps involved in it

Get step-by-step solutions from verified subject matter experts


