Desperately need help.
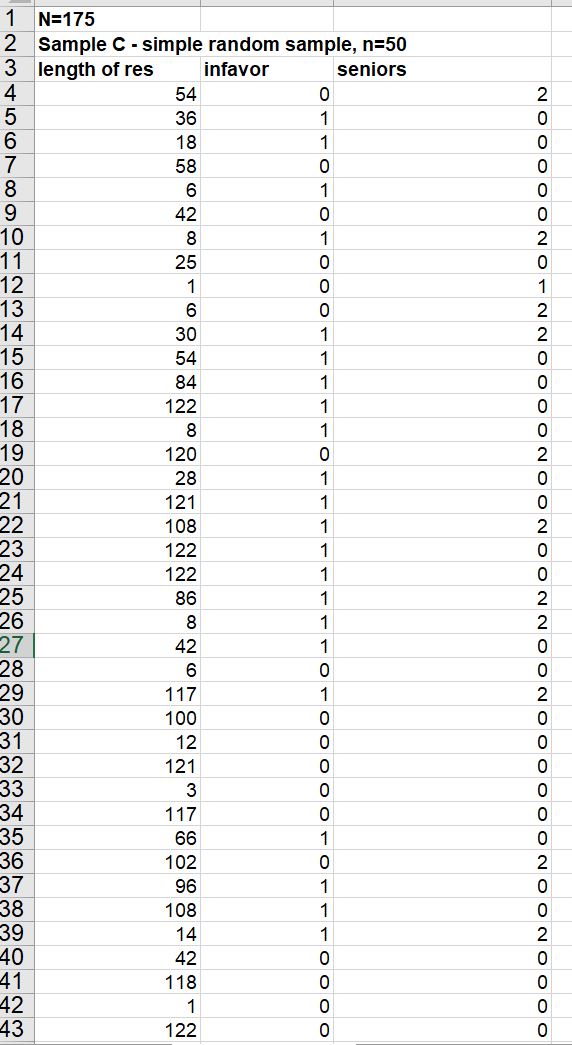
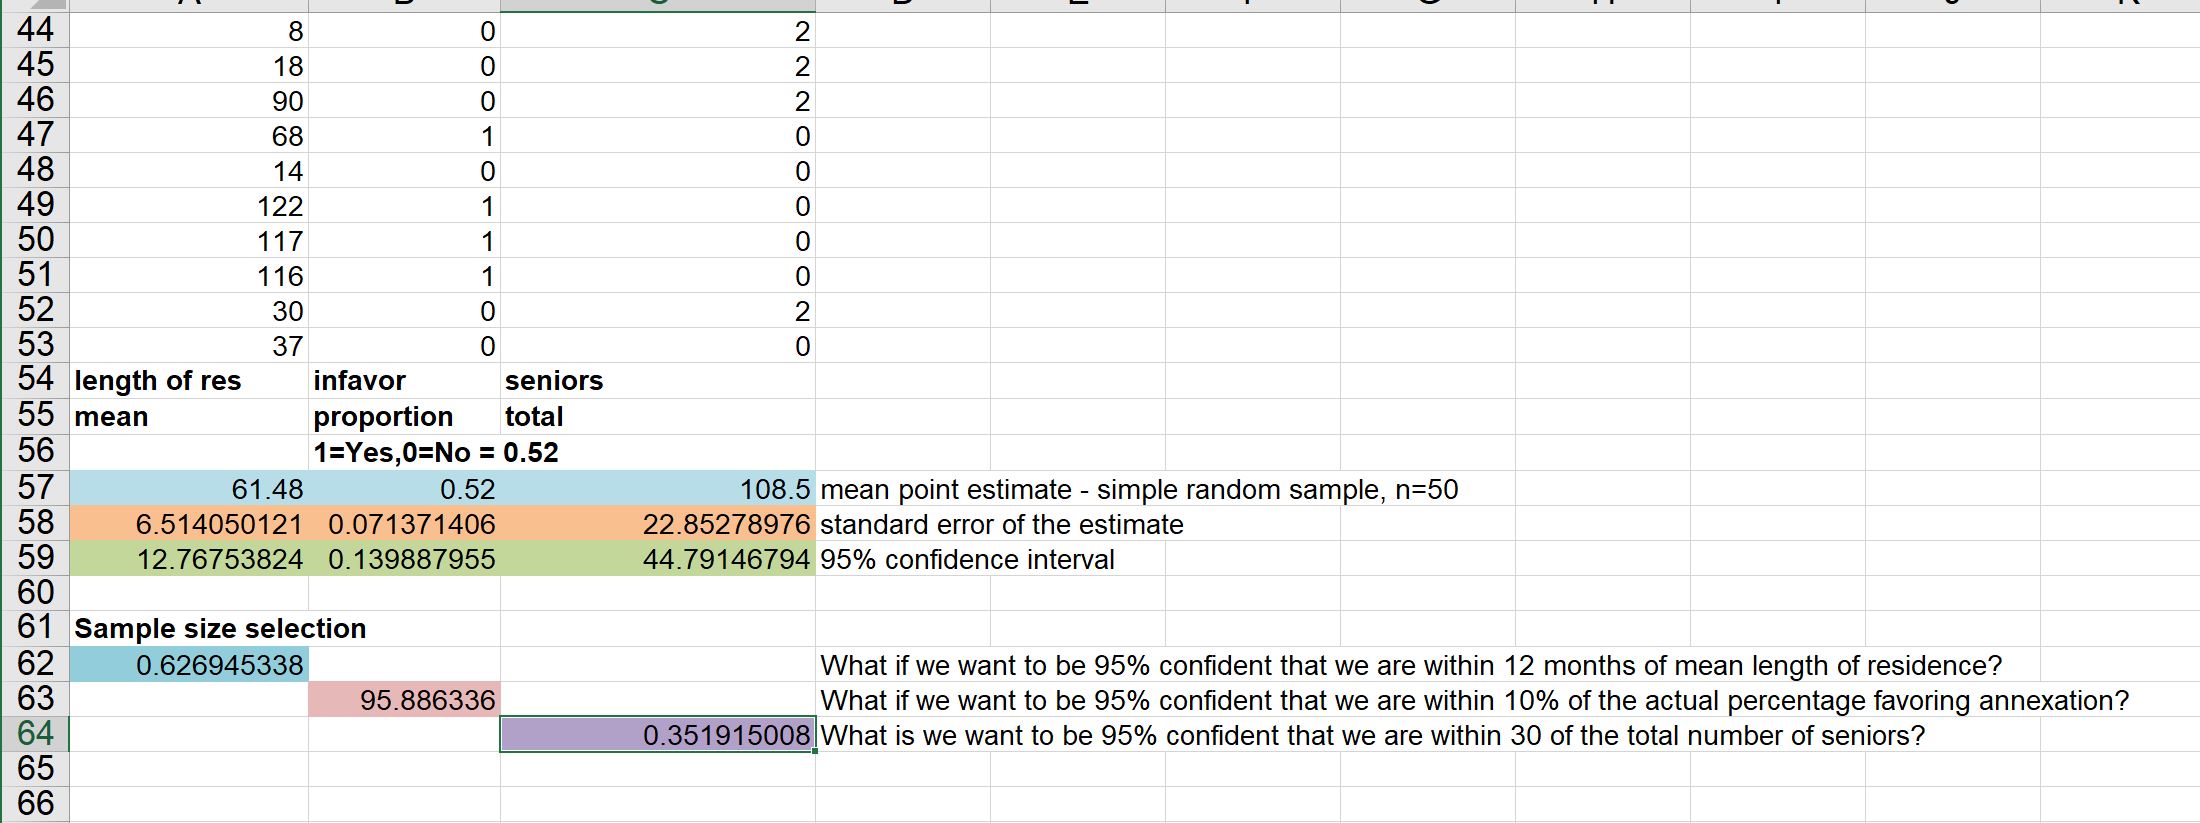
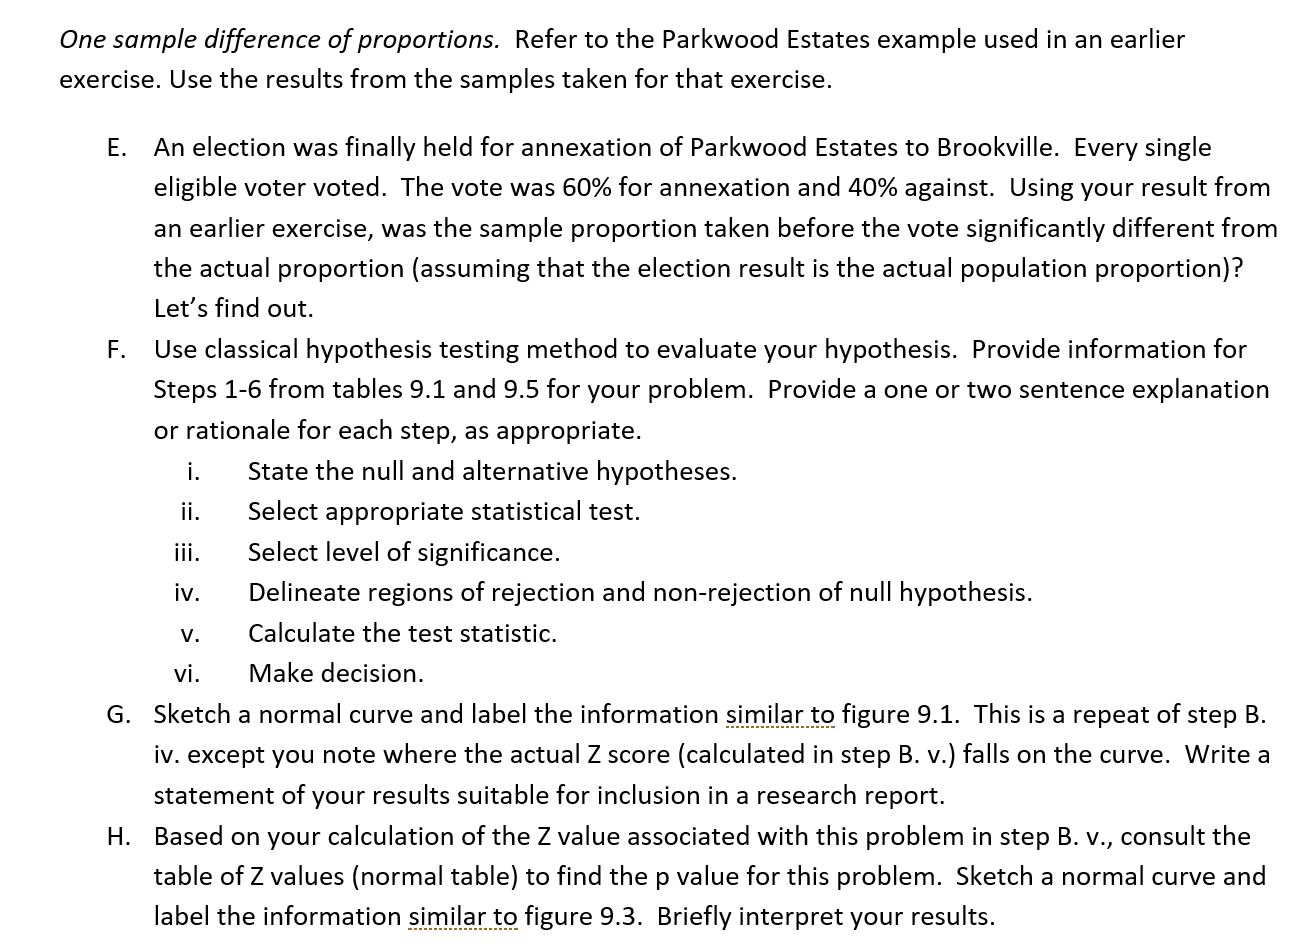
\f44 8 45 18 46 90 47 68 48 14 o o - - - o - 0 0 0 ONOOOOONNN 49 122 50 117 51 116 52 30 53 37 54 length of res infavor seniors 55 mean proportion total 56 1=Yes,0=No = 0.52 57 61.48 0.52 108.5 mean point estimate - simple random sample, n=50 58 6.514050121 0.071371406 22.85278976 standard error of the estimate 59 12.76753824 0.139887955 44.79146794 95% confidence interval 60 61 Sample size selection 62 0.626945338 What if we want to be 95% confident that we are within 12 months of mean length of residence? 63 95.886336 What if we want to be 95% confident that we are within 10% of the actual percentage favoring annexation? 64 0.351915008 What is we want to be 95% confident that we are within 30 of the total number of seniors? 65 66One sample difference ofproportions. Refer to the Parkwood Estates example used in an earlier exercise. Use the results from the samples taken for that exercise. 5. An election was finally held for annexation of Parkwood Estates to Brookville. Every single eligible voter voted. The vote was 60% for annexation and 40% against. Using your result from an earlier exercise, was the sample proportion taken before the vote significantly different from the actual proportion (assuming that the election result is the actual population proportion)? Let's find out. F. Use classical hypothesis testing method to evaluate your hypothesis. Provide information for Steps 16 from tables 9.1 and 9.5 for your problem. Provide a one or two sentence explanation or rationale for each step, as appropriate. i. State the null and alternative hypotheses. ii. Select appropriate statistical test. iii. Select level of significance. iv. Delineate regions of rejection and non-rejection of null hypothesis. v. Calculate the test statistic. vi. Make decision. G. Sketch a normal curve and label the information s_i_r_n_i_l_ar__tg figure 9.1. This is a repeat of step B. iv. except you note where the actual 2 score (calculated in step B. v.) falls on the curve. Write a statement of your results suitable for inclusion in a research report. H. Based on your calculation of the Z value associated with this problem in step B. v., consult the table of 2 values (normal table) to find the p value for this problem. Sketch a normal curve and label the information similartg figure 9.3. Briefly interpret your results