Answered step by step
Verified Expert Solution
Question
1 Approved Answer
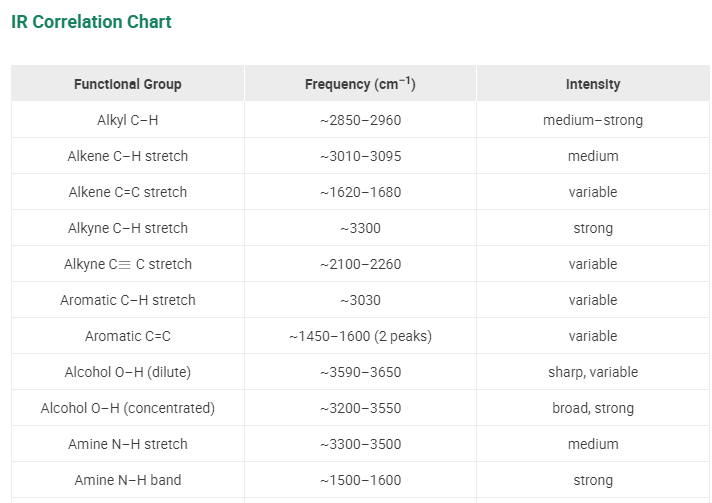
Detail explanation For the compounds below, provide IR tables to show what peaks would be expected if you submitted the compounds for IR analysis. Indicate
Detail explanation
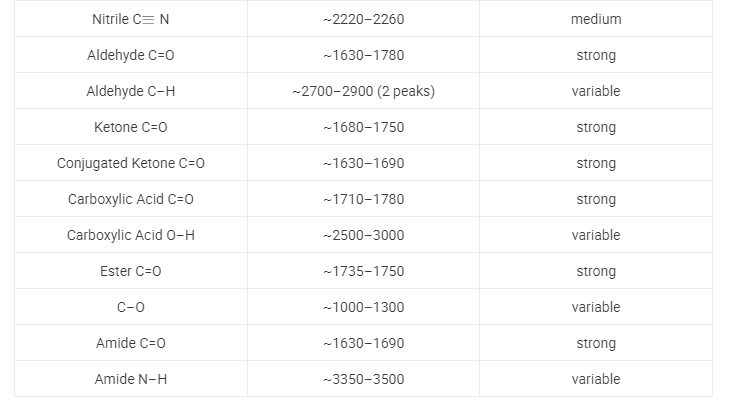
For the compounds below, provide IR tables to show what peaks would be expected if you submitted the compounds for IR analysis. Indicate approximate peak frequencies and the corresponding functional groups. IR Correlation Chart \begin{tabular}{|c|c|c|} \hline Nitrile CN & 22202260 & medium \\ \hline Aldehyde C=O & 16301780 & strong \\ \hline Aldehyde C-H & 27002900(2 peaks) & variable \\ \hline Ketone C=0 & 16801750 & strong \\ \hline Conjugated Ketone C=0 & 16301690 & strong \\ \hline Carboxylic Acid C=0 & 17101780 & strong \\ \hline Carboxylic Acid O-H & 25003000 & variable \\ \hline Ester C=0 & 17351750 & strong \\ \hline C-O & 10001300 & variable \\ \hline Amide C=0 & 16301690 & strong \\ \hline Amide NH & 33503500 & variable \\ \hline \end{tabular}Step by Step Solution
There are 3 Steps involved in it
Step: 1
Get Instant Access to Expert-Tailored Solutions
See step-by-step solutions with expert insights and AI powered tools for academic success
Step: 2
Step: 3
Ace Your Homework with AI
Get the answers you need in no time with our AI-driven, step-by-step assistance
Get Started