Answered step by step
Verified Expert Solution
Question
1 Approved Answer
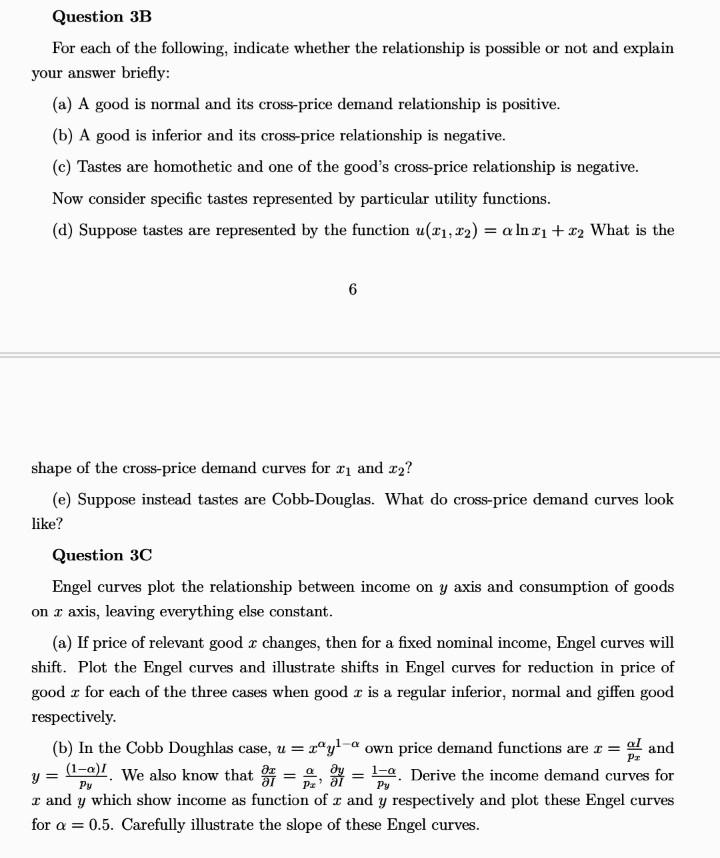
detailed answers to each part and graphs Question 3B For each of the following, indicate whether the relationship is possible or not and explain your

detailed answers to each part and graphs
Question 3B For each of the following, indicate whether the relationship is possible or not and explain your answer briefly: (a) A good is normal and its cross-price demand relationship is positive. (b) A good is inferior and its cross-price relationship is negative. (C) Tastes are homothetic and one of the good's cross-price relationship is negative. Now consider specific tastes represented by particular utility functions. (d) Suppose tastes are represented by the function u(11, 12) = a In 21 + x2 What is the 6 shape of the cross-price demand curves for 21 and 22? (e) Suppose instead tastes are Cobb-Douglas. What do cross-price demand curves look like? Question 3C Engel curves plot the relationship between income on y axis and consumption of goods on r axis, leaving everything else constant. (a) If price of relevant good x changes, then for a fixed nominal income, Engel curves will shift. Plot the Engel curves and illustrate shifts in Engel curves for reduction in price of good for each of the three cases when good r is a regular inferior, normal and giffen good respectively. (b) In the Cobb Doughlas case, u = zyl a own price demand functions are r = al and (1-a)! We also know that I y = = 1-0. Derive the income demand curves for T and y which show income as function of u and y respectively and plot these Engel curves for a = = 0.5. Carefully illustrate the slope of these Engel curves. PE Q PX Py PyStep by Step Solution
There are 3 Steps involved in it
Step: 1

Get Instant Access to Expert-Tailored Solutions
See step-by-step solutions with expert insights and AI powered tools for academic success
Step: 2

Step: 3

Ace Your Homework with AI
Get the answers you need in no time with our AI-driven, step-by-step assistance
Get Started


