Question
Details: dataset: https://github.com/ageron/handson-ml a. Start with Example 1-1: Training and running a linear model using Scikit-Learn from Aurlien Gron textbook. b. Show the code running

Details:
dataset: https://github.com/ageron/handson-ml
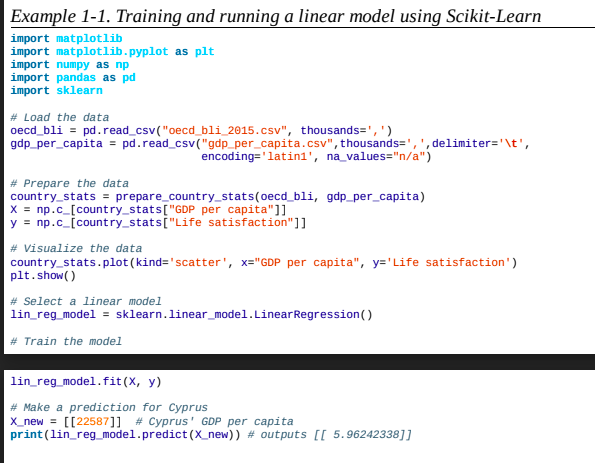
a. Start with Example 1-1: Training and running a linear model using Scikit-Learn from Aurlien Gron textbook.
b. Show the code running under Python 3 along with correct output.
c. Modify the code have a second model using k neighbors regression with n neighbors value of 3.
d. Compare the results between the linear regression and k neighbors regression. Explain why they are different.
e. Measure the time used in the following stages: 1. Loading the data, 2. Training the model, and 3. Making the prediction. How does these measurements differ for the linear regression vs. k neighbors regression?
Please provide all source code, test cases, data files used, screen snapshots of your code being compiled, running and provide a report with your analysis and explanation of your results. You may combine all files into a single PDF file Word document file or place all files into a single ZIP archive.
Example 1-1. Training and running a linear model using Scikit-Learn import matplotlib import matplotlib.pyplot as plt import numpy as np import pandas as pd import sklearn # Load the data oecd bli pd.read csv("oecd bli_2015.csv", thousands-',') gdp per_capita pd.read_csv( "gdp_per_capita.csv", thousands-",',delimiter- 't', encoding-'latini', na values-"n/a") # Prepare the data country_statsprepare_country_stats(oecd bli, gdp per_capita) x = np.c-[country-stats("GDP per capita"]] y np.c[country stats["Life satisfaction"]] # Visualize the data country_stats.plot (kind-scatter, x-"GDP per capita", y'Life satisfaction") plt.show() # Select a linear model lin reg model- sklearn.linear_model.LinearRegression() # Train the model lin reg model.fit(X, y) # Make a prediction for Cyprus x-new- [[22587]] # Cyprus' GDP per capita print (lin-reg-model . predict (X-new)) # outputs [[ 5.96242338]] Example 1-1. Training and running a linear model using Scikit-Learn import matplotlib import matplotlib.pyplot as plt import numpy as np import pandas as pd import sklearn # Load the data oecd bli pd.read csv("oecd bli_2015.csv", thousands-',') gdp per_capita pd.read_csv( "gdp_per_capita.csv", thousands-",',delimiter- 't', encoding-'latini', na values-"n/a") # Prepare the data country_statsprepare_country_stats(oecd bli, gdp per_capita) x = np.c-[country-stats("GDP per capita"]] y np.c[country stats["Life satisfaction"]] # Visualize the data country_stats.plot (kind-scatter, x-"GDP per capita", y'Life satisfaction") plt.show() # Select a linear model lin reg model- sklearn.linear_model.LinearRegression() # Train the model lin reg model.fit(X, y) # Make a prediction for Cyprus x-new- [[22587]] # Cyprus' GDP per capita print (lin-reg-model . predict (X-new)) # outputs [[ 5.96242338]]Step by Step Solution
There are 3 Steps involved in it
Step: 1

Get Instant Access to Expert-Tailored Solutions
See step-by-step solutions with expert insights and AI powered tools for academic success
Step: 2

Step: 3

Ace Your Homework with AI
Get the answers you need in no time with our AI-driven, step-by-step assistance
Get Started


