Determinants of security value include company profitability, operating growth, and risk. The first determinant was covered in Step 1. In Step 2 we complete our analysis with:
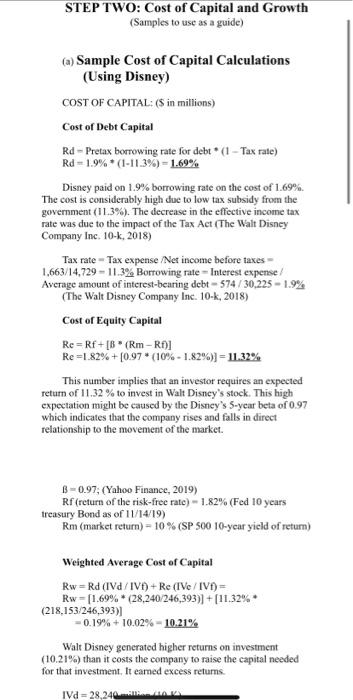
(a) cost of capital (debt, equity, weighted) and
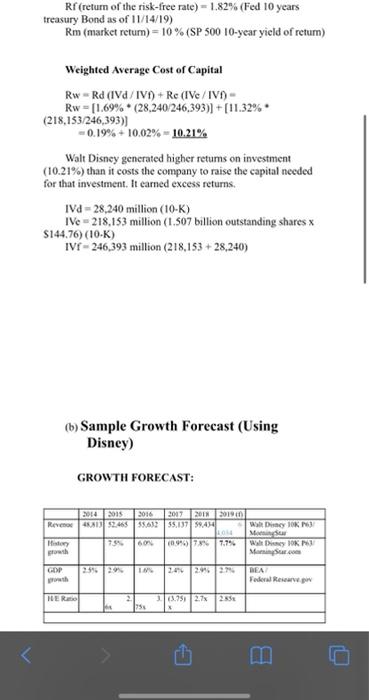
(b)growth forecast using internal measurements and external data from industry, and macroeconomic analysis.
these were the examples professor used
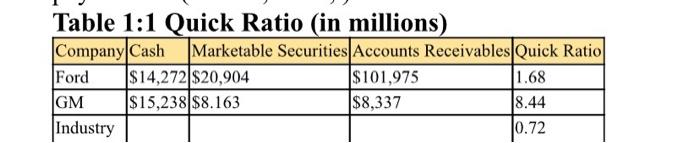
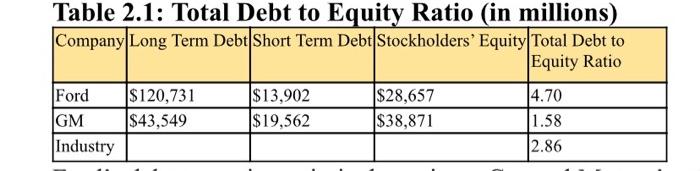
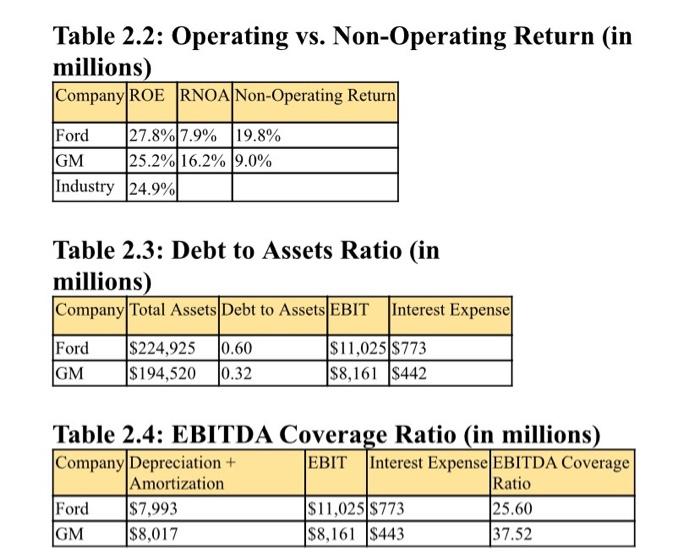
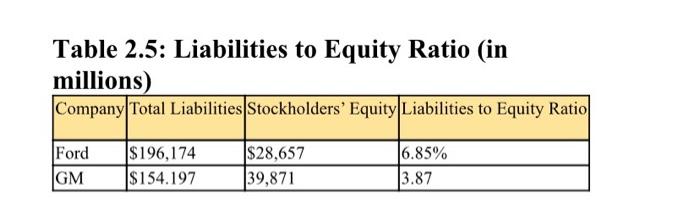
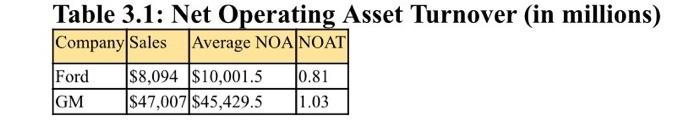
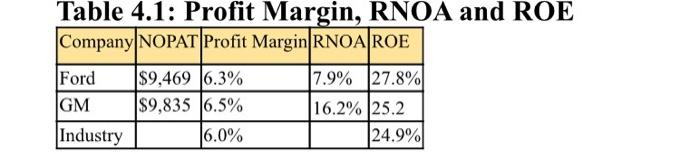
Table 1:1 Quick Ratio (in millions) Company Cash Marketable Securities Accounts Receivables Quick Ratio Ford $14,272 $20,904 $101,975 1.68 GM $15,238 $8.163 $8,337 8.44 Industry 10.72 Table 2.1: Total Debt to Equity Ratio (in millions) Company Long Term Debt Short Term Debt Stockholders' Equity Total Debt to Equity Ratio Ford $120,731 $13,902 $28,657 4.70 GM $43,549 $19,562 $38,871 1.58 Industry 12.86 Table 2.2: Operating vs. Non-Operating Return (in millions) Company ROE RNOA Non-Operating Return Ford 27.8% 7.9% 19.8% GM 25.2% 16.2% 9.0% Industry 24.9% Table 2.3: Debt to Assets Ratio (in millions) Company Total Assets Debt to Assets EBIT Interest Expense Ford GM $224,925 0.60 $194,5200.32 $11,025 $773 $8,161 $442 Table 2.4: EBITDA Coverage Ratio (in millions) Company Depreciation Interest Expense EBITDA Coverage Amortization Ratio Ford $7,993 $11,025 $773 25.60 GM $8,017 $8,161 $443 37.52 Table 2.5: Liabilities to Equity Ratio (in millions) Company Total Liabilities Stockholders' Equity Liabilities to Equity Ratio Ford GM $196,174 $154.197 $28,657 39,871 16.85% 3.87 Table 3.1: Net Operating Asset Turnover (in millions) Company Sales Average NOA NOAT Ford $8,094 $10,001.5 0.81 $47,007 $45,429.5 GM 1.03 Table 4.1: Profit Margin, RNOA and ROE Company NOPAT Profit Margin RNOAROE Ford $9,469 16.3% 7.9% 27.8% GM $9,835 16.5% 16.2% 25.2 Industry 16.0% 24.9% STEP TWO: Cost of Capital and Growth (Samples to use as a guide) (a) Sample Cost of Capital Calculations (Using Disney) COST OF CAPITAL: (Sin millions) Cost of Debt Capital Rd - Pretax borrowing rate for debt* (1 - Tax rate) Rd =1.9% (1-11.3%) - 1.69% Disney paid on 1.9% borrowing rate on the cost of 1.69% The cost is considerably high due to low tax subsidy from the government (11.3%). The decrease in the effective income tax rate was due to the impact of the Tax Act (The Walt Disney Company Inc. 10-k, 2018) Tax rate Tax expense /Net income before taxes 1,663/14,729 - 11.3% Borrowing rate - Interest expense! Average amount of interest-bearing debt - 574/30,225 -1.9% (The Walt Disney Company Inc. 10-k, 2018) Cost of Equity Capital Re=Rf+[B (Rm-RA] Re =1.82% +[0.97 * (10% - 1.82%)] = 11.32% This number implies that an investor requires an expected return of 11.32 % to invest in Walt Disney's stock. This high expectation might be caused by the Disney's 5-year beta of 0.97 which indicates that the company rises and falls in direct relationship to the movement of the market. 8 -0.97; (Yahoo Finance, 2019) Rf (return of the risk-free rate) - 1.82% (Fed 10 years treasury Bond as of 11/14/19) Rm (market return) = 10%(SP 500 10-year yield of return) Weighted Average Cost of Capital Rw = Rd (IV/IV)+ Re (IV/IV)= Rw = [1.69%* (28,240/246,393)) + (11.32% (218.153/246,393) -0.19% + 10.02% - 10.21% Walt Disney generated higher returns on investment (10.21%) than it costs the company to raise the capital needed for that investment. It eamed excess returns. IV. -28,24 Rf (return of the risk-free rate) - 1.82% (Fed 10 years treasury Bond as of 11/14/19) Rm (market retum) = 10% (SP 500 10-year yield of return) Weighted Average Cost of Capital Rw Rd (IV/IV+) + Re (IV/IV)- Rw = [1.69% (28.240/246,393)] + [11.32% (218,153/246,393)) -0.19% + 10.02% - 10.21% Walt Disney generated higher retums on investment (10.21%) than it costs the company to raise the capital needed for that investment. It camed excess returns. IVd 28,240 million (10-K) IVe = 218,153 million (1.507 billion outstanding shares x $144,76) (10.) IVF - 246,393 million (218,153 +28,240) (b) Sample Growth Forecast (Using Disney) GROWTH FORECAST: 2015 2016 2017 2018 2019 Revo 1152,463551235,13759434 LO Matery 7890 096 78% 7.796 growth WD TOKU M M Walt Di POK Mansur.com DEA Federal Resowe GEP 2:55 20% HER 13.751 27% 1754 o Table 1:1 Quick Ratio (in millions) Company Cash Marketable Securities Accounts Receivables Quick Ratio Ford $14,272 $20,904 $101,975 1.68 GM $15,238 $8.163 $8,337 8.44 Industry 10.72 Table 2.1: Total Debt to Equity Ratio (in millions) Company Long Term Debt Short Term Debt Stockholders' Equity Total Debt to Equity Ratio Ford $120,731 $13,902 $28,657 4.70 GM $43,549 $19,562 $38,871 1.58 Industry 12.86 Table 2.2: Operating vs. Non-Operating Return (in millions) Company ROE RNOA Non-Operating Return Ford 27.8% 7.9% 19.8% GM 25.2% 16.2% 9.0% Industry 24.9% Table 2.3: Debt to Assets Ratio (in millions) Company Total Assets Debt to Assets EBIT Interest Expense Ford GM $224,925 0.60 $194,5200.32 $11,025 $773 $8,161 $442 Table 2.4: EBITDA Coverage Ratio (in millions) Company Depreciation Interest Expense EBITDA Coverage Amortization Ratio Ford $7,993 $11,025 $773 25.60 GM $8,017 $8,161 $443 37.52 Table 2.5: Liabilities to Equity Ratio (in millions) Company Total Liabilities Stockholders' Equity Liabilities to Equity Ratio Ford GM $196,174 $154.197 $28,657 39,871 16.85% 3.87 Table 3.1: Net Operating Asset Turnover (in millions) Company Sales Average NOA NOAT Ford $8,094 $10,001.5 0.81 $47,007 $45,429.5 GM 1.03 Table 4.1: Profit Margin, RNOA and ROE Company NOPAT Profit Margin RNOAROE Ford $9,469 16.3% 7.9% 27.8% GM $9,835 16.5% 16.2% 25.2 Industry 16.0% 24.9% STEP TWO: Cost of Capital and Growth (Samples to use as a guide) (a) Sample Cost of Capital Calculations (Using Disney) COST OF CAPITAL: (Sin millions) Cost of Debt Capital Rd - Pretax borrowing rate for debt* (1 - Tax rate) Rd =1.9% (1-11.3%) - 1.69% Disney paid on 1.9% borrowing rate on the cost of 1.69% The cost is considerably high due to low tax subsidy from the government (11.3%). The decrease in the effective income tax rate was due to the impact of the Tax Act (The Walt Disney Company Inc. 10-k, 2018) Tax rate Tax expense /Net income before taxes 1,663/14,729 - 11.3% Borrowing rate - Interest expense! Average amount of interest-bearing debt - 574/30,225 -1.9% (The Walt Disney Company Inc. 10-k, 2018) Cost of Equity Capital Re=Rf+[B (Rm-RA] Re =1.82% +[0.97 * (10% - 1.82%)] = 11.32% This number implies that an investor requires an expected return of 11.32 % to invest in Walt Disney's stock. This high expectation might be caused by the Disney's 5-year beta of 0.97 which indicates that the company rises and falls in direct relationship to the movement of the market. 8 -0.97; (Yahoo Finance, 2019) Rf (return of the risk-free rate) - 1.82% (Fed 10 years treasury Bond as of 11/14/19) Rm (market return) = 10%(SP 500 10-year yield of return) Weighted Average Cost of Capital Rw = Rd (IV/IV)+ Re (IV/IV)= Rw = [1.69%* (28,240/246,393)) + (11.32% (218.153/246,393) -0.19% + 10.02% - 10.21% Walt Disney generated higher returns on investment (10.21%) than it costs the company to raise the capital needed for that investment. It eamed excess returns. IV. -28,24 Rf (return of the risk-free rate) - 1.82% (Fed 10 years treasury Bond as of 11/14/19) Rm (market retum) = 10% (SP 500 10-year yield of return) Weighted Average Cost of Capital Rw Rd (IV/IV+) + Re (IV/IV)- Rw = [1.69% (28.240/246,393)] + [11.32% (218,153/246,393)) -0.19% + 10.02% - 10.21% Walt Disney generated higher retums on investment (10.21%) than it costs the company to raise the capital needed for that investment. It camed excess returns. IVd 28,240 million (10-K) IVe = 218,153 million (1.507 billion outstanding shares x $144,76) (10.) IVF - 246,393 million (218,153 +28,240) (b) Sample Growth Forecast (Using Disney) GROWTH FORECAST: 2015 2016 2017 2018 2019 Revo 1152,463551235,13759434 LO Matery 7890 096 78% 7.796 growth WD TOKU M M Walt Di POK Mansur.com DEA Federal Resowe GEP 2:55 20% HER 13.751 27% 1754 o