

Question
Determination of caffeine content of tea and instand coffee brands found in Kenyan Market. Use the graph to to find the maximum absorbance wavelength for
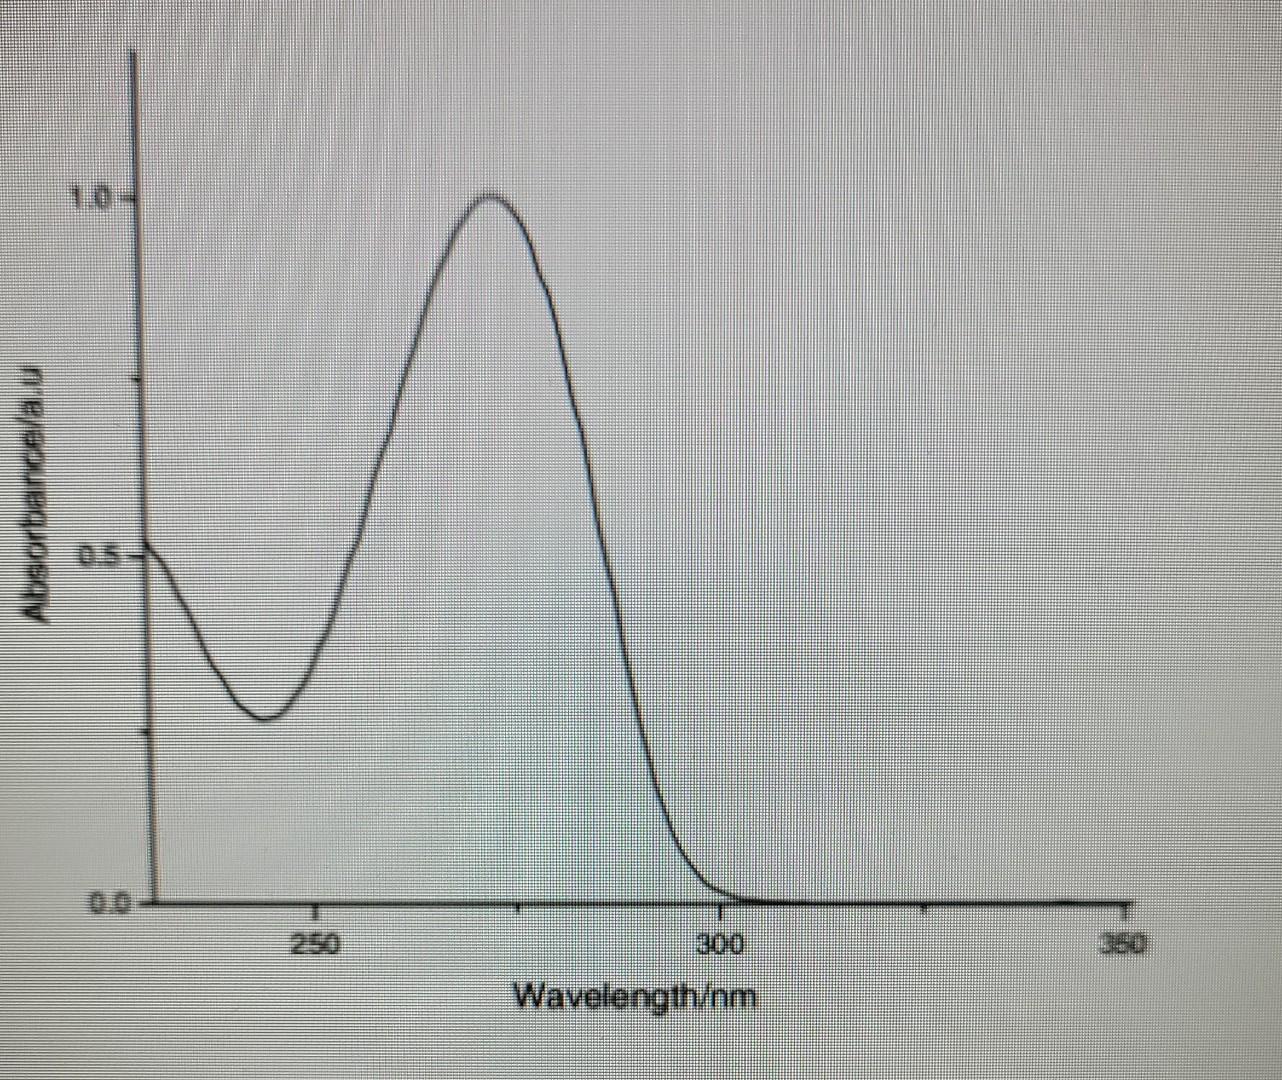
Determination of caffeine content of tea and instand coffee brands found in Kenyan Market. Use the graph to to find the maximum absorbance wavelength for caffeine.
then create a standard reference graph
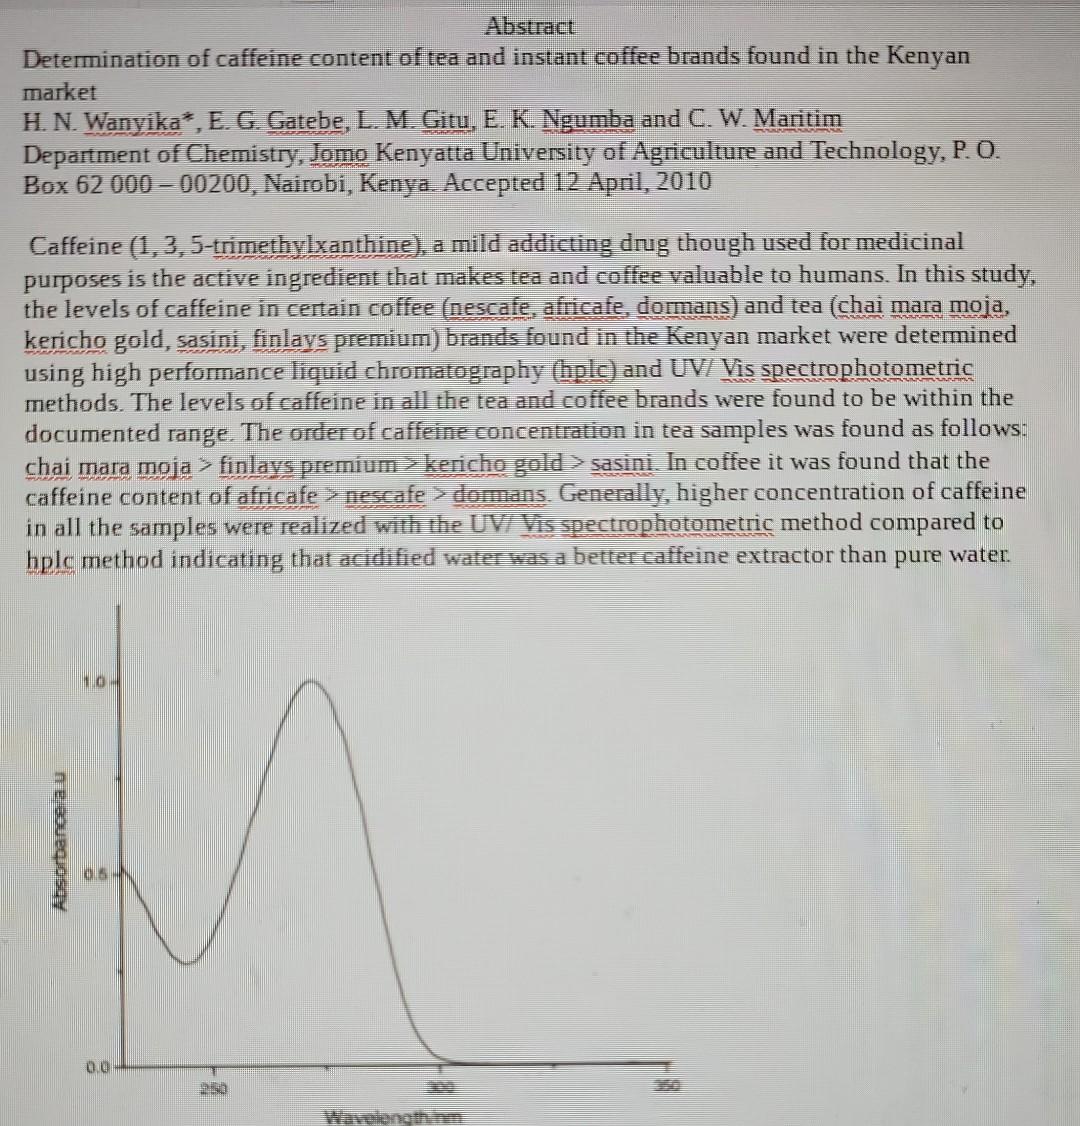
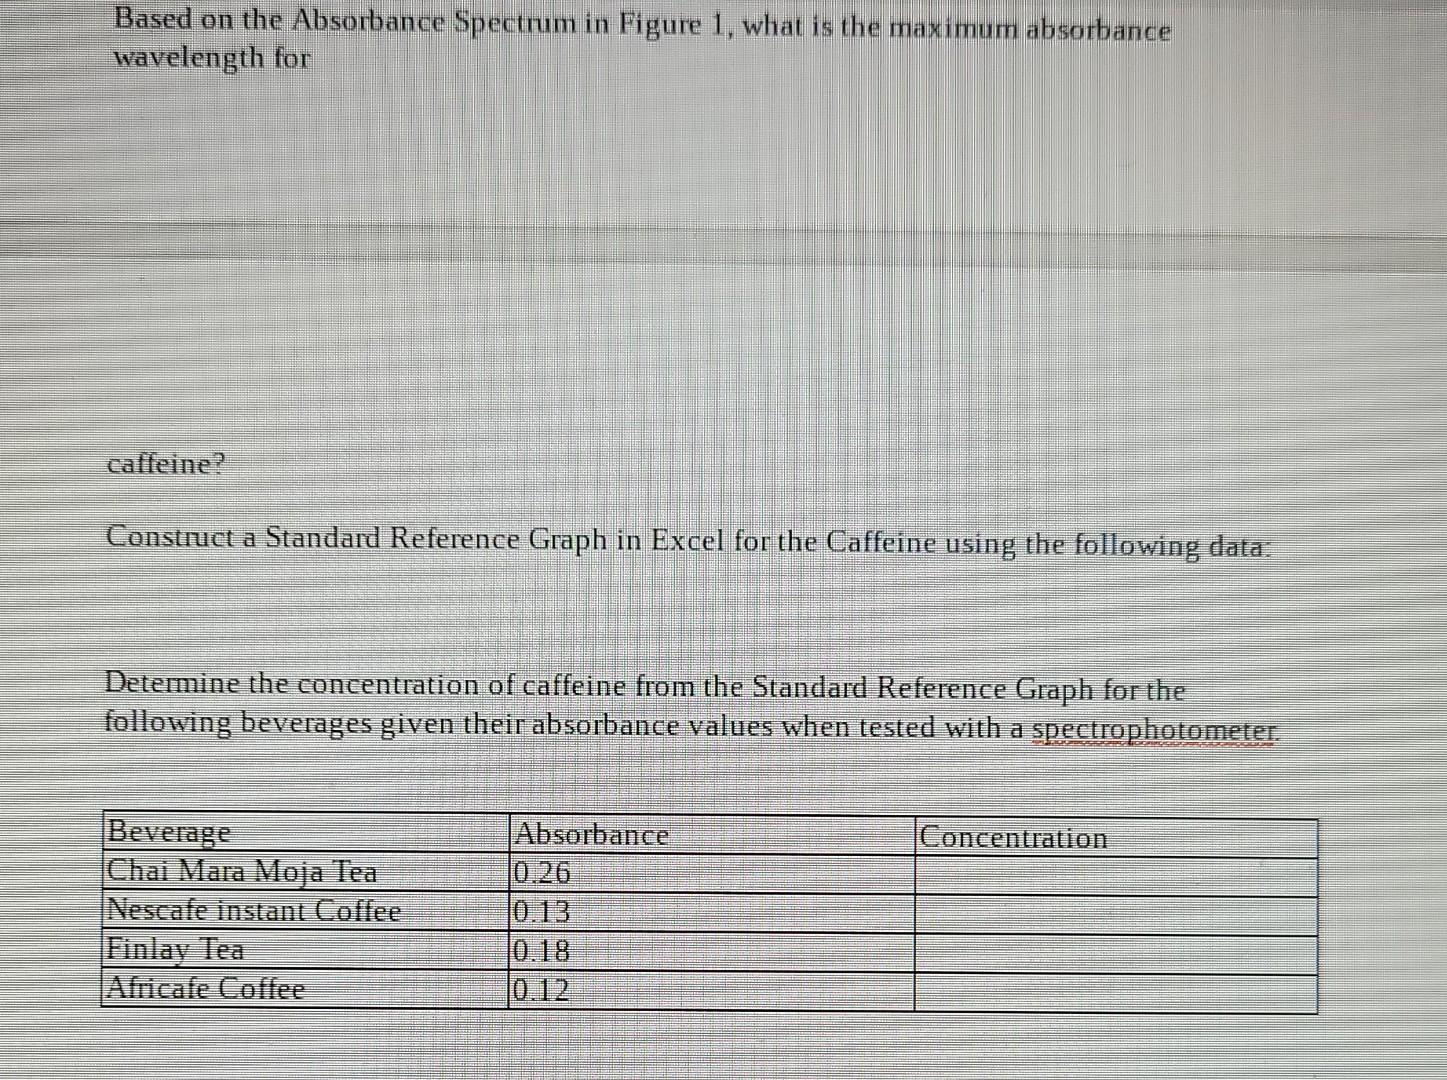
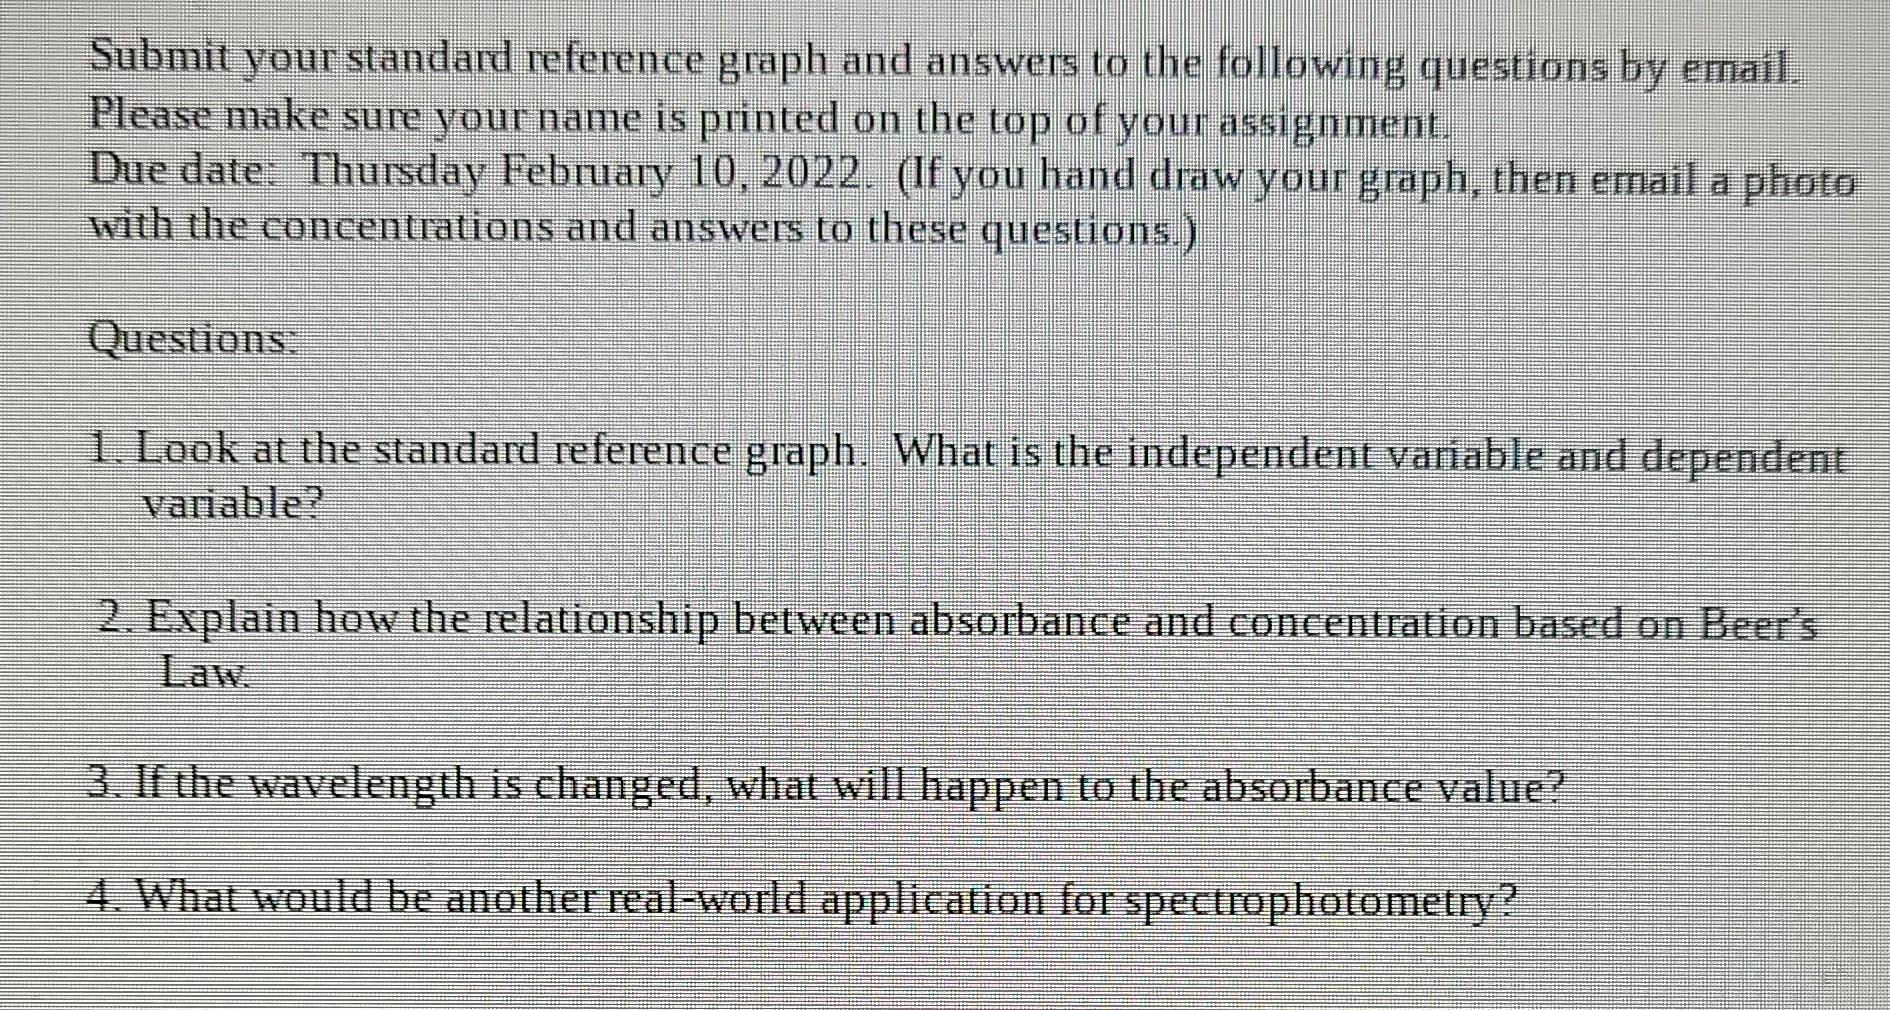
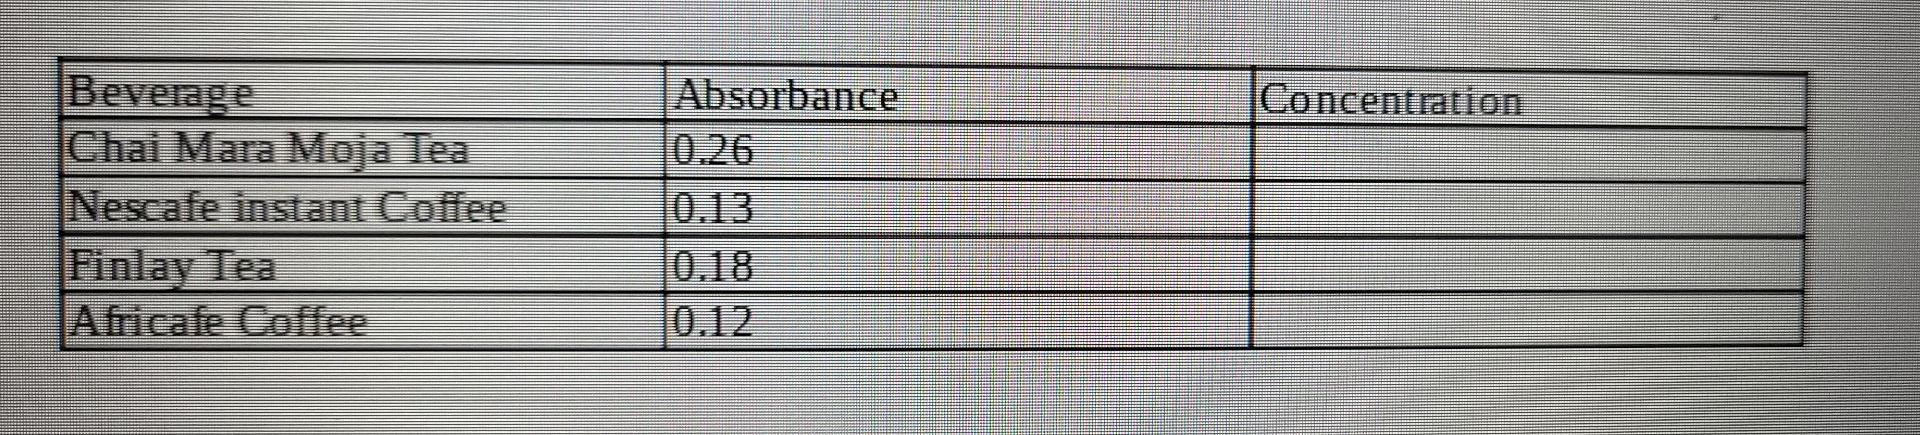
Abstract Determination of caffeine content of tea and instant coffee brands found in the Kenyan market H. N. Wanyika", E. G. Gatebe, L. M. Gitu, E. K. Ngumba and C. W. Maritim Department of Chemistry, Jomo Kenyatta University of Agriculture and Technology, P. O. Box 62 000 - 00200, Nairobi, Kenya. Accepted 12 April, 2010 Caffeine (1,3,5-trimethylxanthine), a mild addicting drug though used for medicinal purposes is the active ingredient that makes tea and coffee valuable to humans. In this study, the levels of caffeine in certain coffee (nescafe, africafe, dormans) and tea (chai mara moja, kericho gold, sasini, finlays premium) brands found in the Kenyan market were determined using high performance liquid chromatography (hplc) and UV/ Vis spectrophotometric methods. The levels of caffeine in all the tea and coffee brands were found to be within the documented range. The order of caffeine concentration in tea samples was found as follows: chai mara moja > finlays premium > cho gold sasini. In coffee it was found that the caffeine content of africafe > pescafe > domans. Generally, higher concentration of caffeine in all the samples were realized with the UV/ Vis spectrophotometric method compared to hplc method indicating that acidified water was a better caffeine extractor than pure water. Absorbare au OS 0.0 2 ung Based on the Absorbance Spectrum in Figure 1, what is the maximum absorbance wavelength for caffeine? Construct a Standard Reference Graph in Excel for the Caffeine using the following data: Determine the concentration of caffeine from the Standard Reference Graph for the following beverages given their absorbance values when tested with a spectrophotometer. Concentration Beverage Chai Mara Moja Tea Nescafe instant Coffee Finlay Tea Africafe Coffee Absorbance 0.26 0.13 0.18 Submit your standard reference graph and answers to the following questions by email. Please make sure your name is printed on the top of your assignment. Due date: Thursday February 10, 2022. (If you hand draw your graph, then email a photo with the concentrations and answers to these questions.) Questions: 1. Look at the standard reference graph. What is the independent vanable and dependent Variable? 2. Explain how the relationship between absorbance and concentration based on Beer's 3. If the wavelength is changed, what will happen to the absorbance value? 4. What would be another real-world application for spectrophotometry? Absorbance/a u Concentration Beverage Chai Mara Moja Tea Nescafe instant Coffee Finante Africafe Coffee Absorbance 0.26 0.13 0.12 Abstract Determination of caffeine content of tea and instant coffee brands found in the Kenyan market H. N. Wanyika", E. G. Gatebe, L. M. Gitu, E. K. Ngumba and C. W. Maritim Department of Chemistry, Jomo Kenyatta University of Agriculture and Technology, P. O. Box 62 000 - 00200, Nairobi, Kenya. Accepted 12 April, 2010 Caffeine (1,3,5-trimethylxanthine), a mild addicting drug though used for medicinal purposes is the active ingredient that makes tea and coffee valuable to humans. In this study, the levels of caffeine in certain coffee (nescafe, africafe, dormans) and tea (chai mara moja, kericho gold, sasini, finlays premium) brands found in the Kenyan market were determined using high performance liquid chromatography (hplc) and UV/ Vis spectrophotometric methods. The levels of caffeine in all the tea and coffee brands were found to be within the documented range. The order of caffeine concentration in tea samples was found as follows: chai mara moja > finlays premium > cho gold sasini. In coffee it was found that the caffeine content of africafe > pescafe > domans. Generally, higher concentration of caffeine in all the samples were realized with the UV/ Vis spectrophotometric method compared to hplc method indicating that acidified water was a better caffeine extractor than pure water. Absorbare au OS 0.0 2 ung Based on the Absorbance Spectrum in Figure 1, what is the maximum absorbance wavelength for caffeine? Construct a Standard Reference Graph in Excel for the Caffeine using the following data: Determine the concentration of caffeine from the Standard Reference Graph for the following beverages given their absorbance values when tested with a spectrophotometer. Concentration Beverage Chai Mara Moja Tea Nescafe instant Coffee Finlay Tea Africafe Coffee Absorbance 0.26 0.13 0.18 Submit your standard reference graph and answers to the following questions by email. Please make sure your name is printed on the top of your assignment. Due date: Thursday February 10, 2022. (If you hand draw your graph, then email a photo with the concentrations and answers to these questions.) Questions: 1. Look at the standard reference graph. What is the independent vanable and dependent Variable? 2. Explain how the relationship between absorbance and concentration based on Beer's 3. If the wavelength is changed, what will happen to the absorbance value? 4. What would be another real-world application for spectrophotometry? Absorbance/a u Concentration Beverage Chai Mara Moja Tea Nescafe instant Coffee Finante Africafe Coffee Absorbance 0.26 0.13 0.12Step by Step Solution
There are 3 Steps involved in it
Step: 1

Get Instant Access to Expert-Tailored Solutions
See step-by-step solutions with expert insights and AI powered tools for academic success
Step: 2

Step: 3
Ace Your Homework with AI
Get the answers you need in no time with our AI-driven, step-by-step assistance
Get Started
Methane Conversion Routes Status And Prospects
Authors: Vladimir Galvita, René Bos
1st Edition
1788014308, 978-1788014304