Answered step by step
Verified Expert Solution
Question
1 Approved Answer
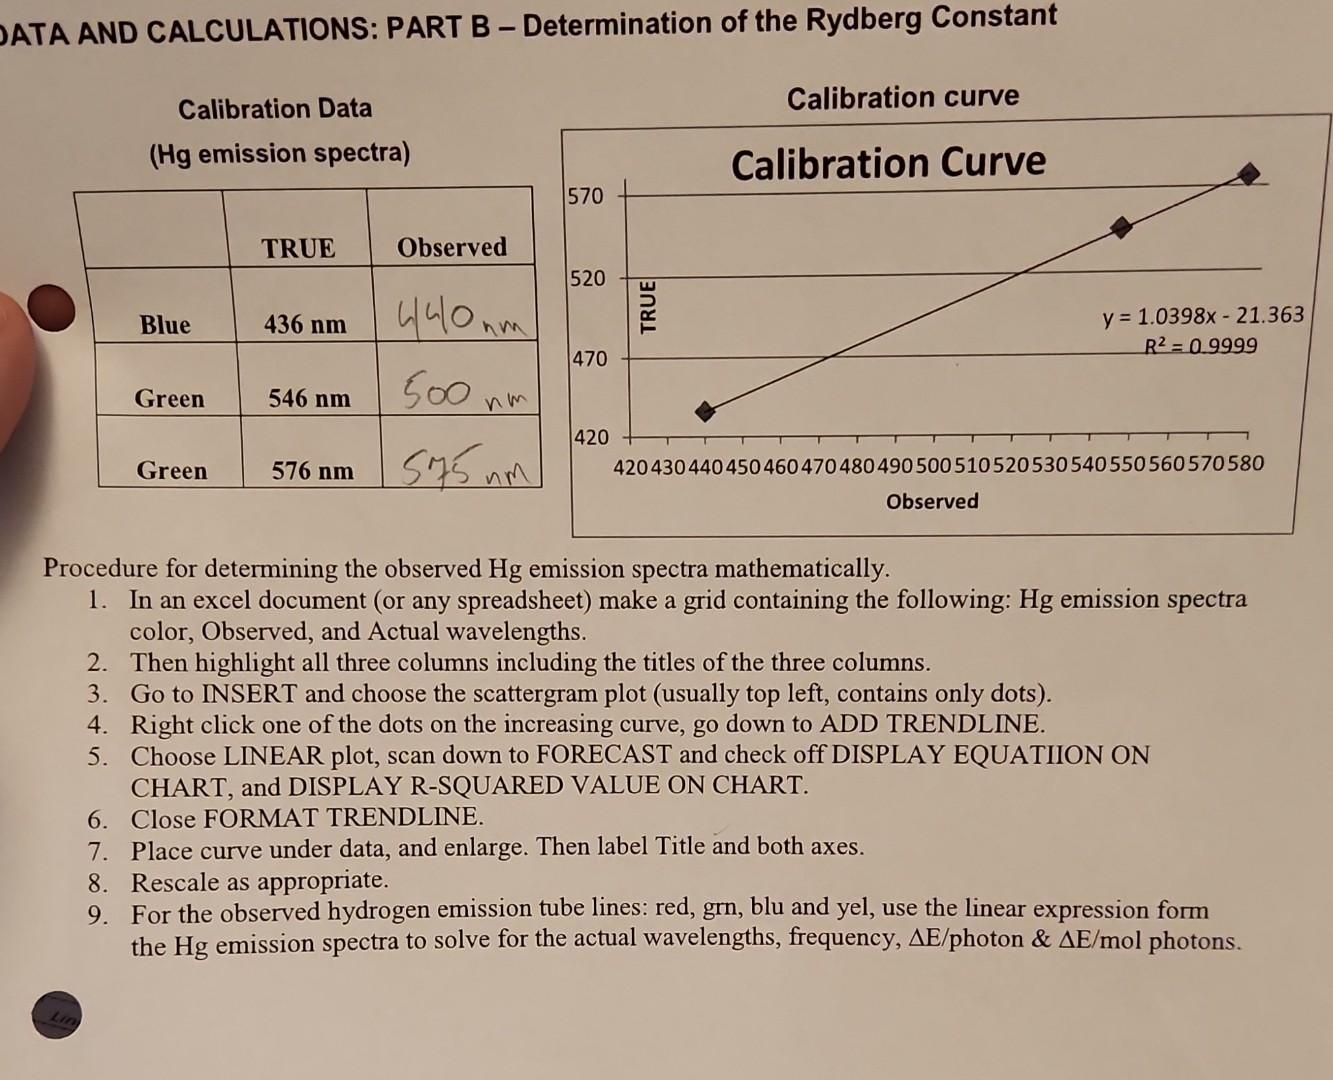
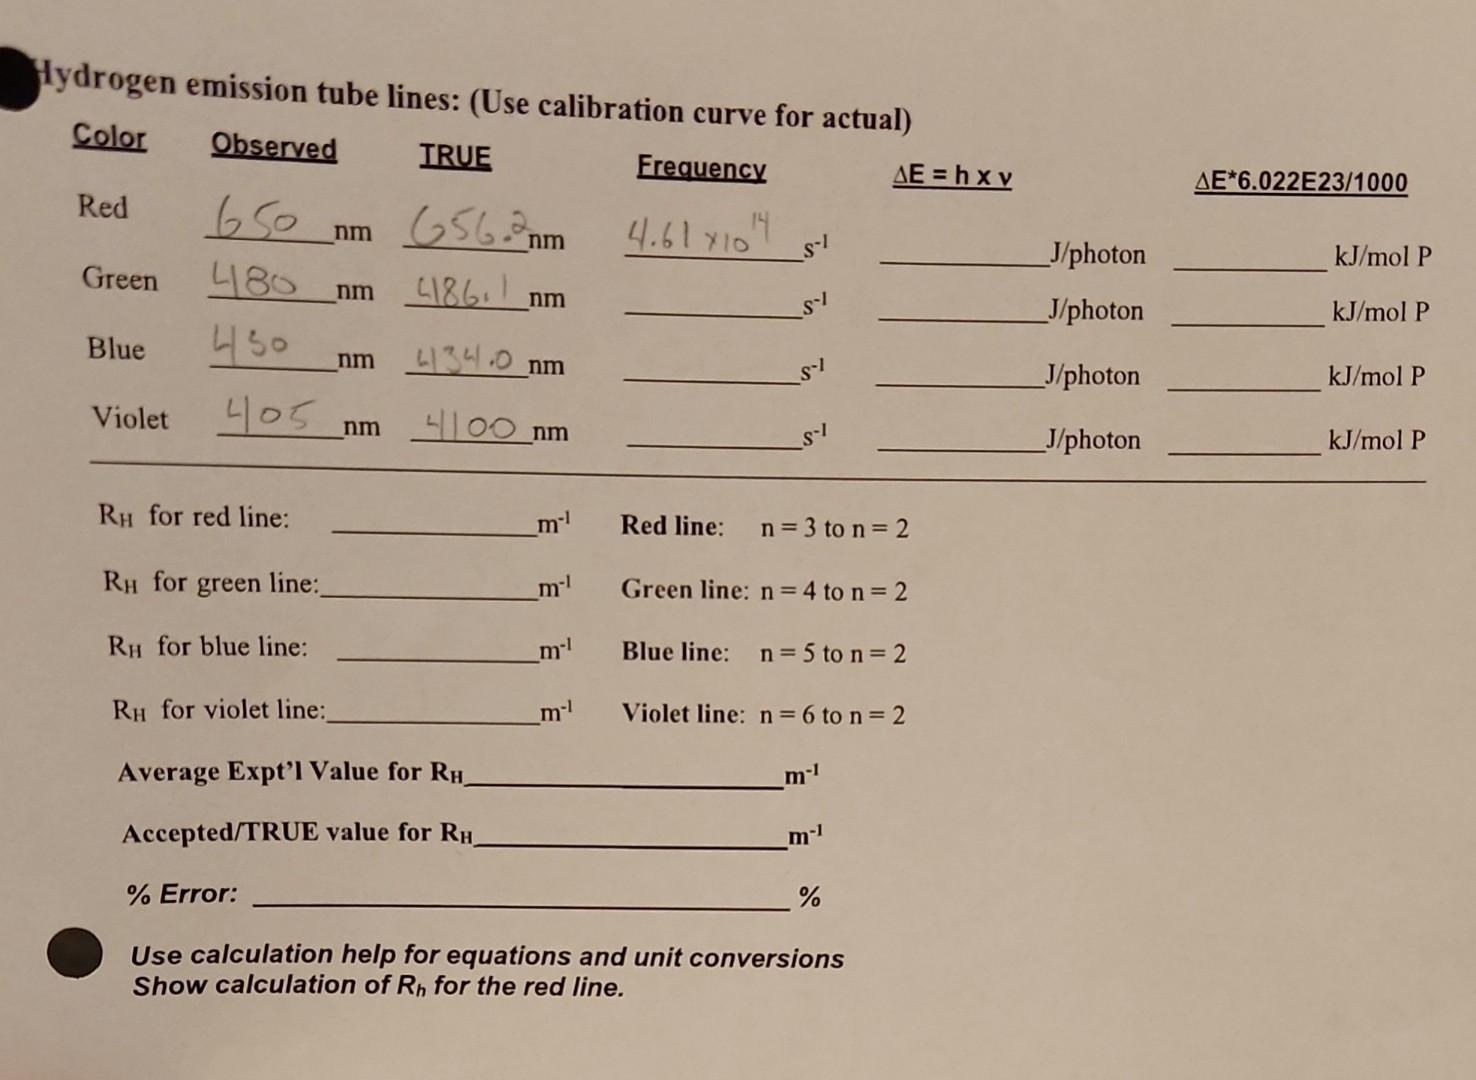
Determination of the Rydberg constant. I am confused about using the calibration curve. Am I using my observed or TRUE? ATA AND CALCULATIONS: PART B
Determination of the Rydberg constant.


I am confused about using the calibration curve. Am I using my observed or TRUE?
ATA AND CALCULATIONS: PART B - Determination of the Rydberg Constant Calibration Data (Hg emission spectra) Procedure for determining the observed Hg emission spectra mathematically. 1. In an excel document (or any spreadsheet) make a grid containing the following: Hg emission spectra color, Observed, and Actual wavelengths. 2. Then highlight all three columns including the titles of the three columns. 3. Go to INSERT and choose the scattergram plot (usually top left, contains only dots). 4. Right click one of the dots on the increasing curve, go down to ADD TRENDLINE. 5. Choose LINEAR plot, scan down to FORECAST and check off DISPLAY EQUATIION ON CHART, and DISPLAY R-SQUARED VALUE ON CHART. 6. Close FORMAT TRENDLINE. 7. Place curve under data, and enlarge. Then label Title and both axes. 8. Rescale as appropriate. 9. For the observed hydrogen emission tube lines: red, grn, blu and yel, use the linear expression form the Hg emission spectra to solve for the actual wavelengths, frequency, E/ photon \& E/mol photons. Hydrogen emission tube lines: (Use calibration curve for actual) RH for red line: m1 Red line: n=3 to n=2 RH for green line: m1 Green line: n=4 to n=2 RH for blue line: m1 Blue line: n=5 to n=2 RH for violet line: m1 Violet line: n=6 to n=2 Average Expt'l Value for RH m1 Accepted/TRUE value for RH m1 \% Error: % Use calculation help for equations and unit conversions Show calculation of Rh for the red line. ATA AND CALCULATIONS: PART B - Determination of the Rydberg Constant Calibration Data (Hg emission spectra) Procedure for determining the observed Hg emission spectra mathematically. 1. In an excel document (or any spreadsheet) make a grid containing the following: Hg emission spectra color, Observed, and Actual wavelengths. 2. Then highlight all three columns including the titles of the three columns. 3. Go to INSERT and choose the scattergram plot (usually top left, contains only dots). 4. Right click one of the dots on the increasing curve, go down to ADD TRENDLINE. 5. Choose LINEAR plot, scan down to FORECAST and check off DISPLAY EQUATIION ON CHART, and DISPLAY R-SQUARED VALUE ON CHART. 6. Close FORMAT TRENDLINE. 7. Place curve under data, and enlarge. Then label Title and both axes. 8. Rescale as appropriate. 9. For the observed hydrogen emission tube lines: red, grn, blu and yel, use the linear expression form the Hg emission spectra to solve for the actual wavelengths, frequency, E/ photon \& E/mol photons. Hydrogen emission tube lines: (Use calibration curve for actual) RH for red line: m1 Red line: n=3 to n=2 RH for green line: m1 Green line: n=4 to n=2 RH for blue line: m1 Blue line: n=5 to n=2 RH for violet line: m1 Violet line: n=6 to n=2 Average Expt'l Value for RH m1 Accepted/TRUE value for RH m1 \% Error: % Use calculation help for equations and unit conversions Show calculation of Rh for the red lineStep by Step Solution
There are 3 Steps involved in it
Step: 1

Get Instant Access to Expert-Tailored Solutions
See step-by-step solutions with expert insights and AI powered tools for academic success
Step: 2

Step: 3

Ace Your Homework with AI
Get the answers you need in no time with our AI-driven, step-by-step assistance
Get Started


