Determine and explain Ryanairs most comparable peers. Which ratios are most suitable to value Ryanair? Based on comparables, determine a stock price valuation for Ryanair.
Use discounted cash flows (DCF) or residual income (ROPI) ROPI to value Ryanair. Is your valuation different from 2: if yes, explain which valuation you would trust the most.
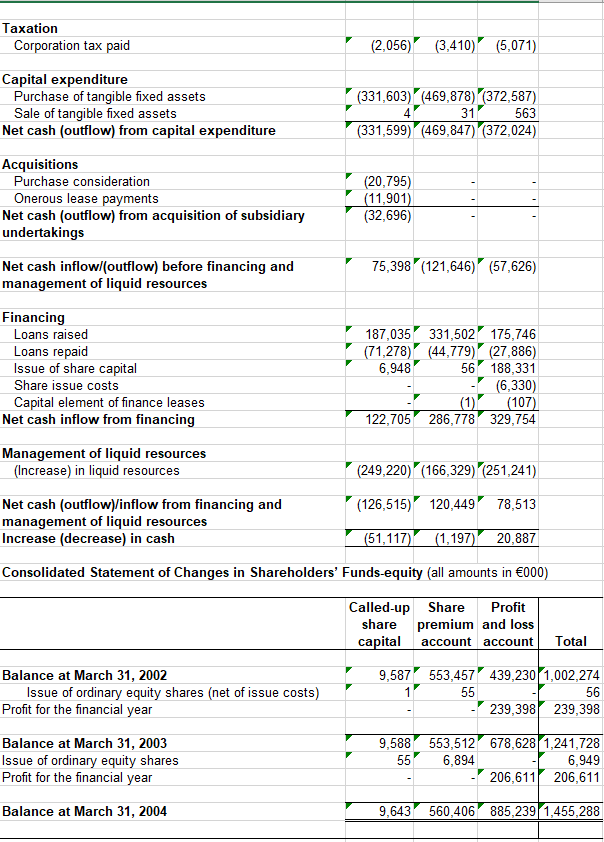
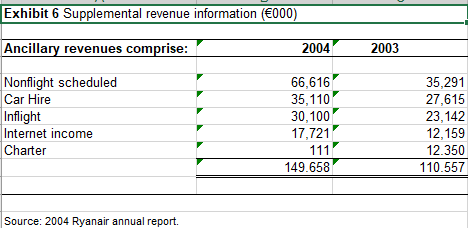
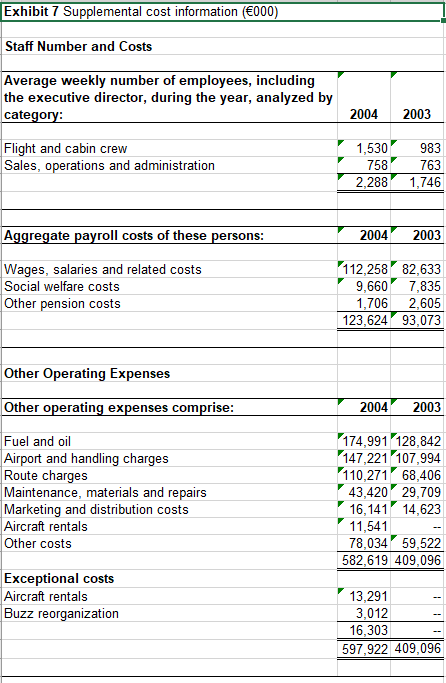
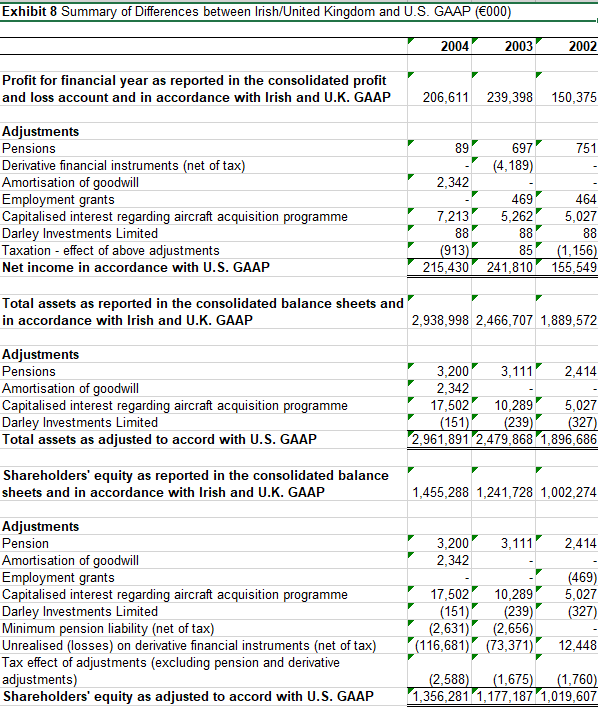
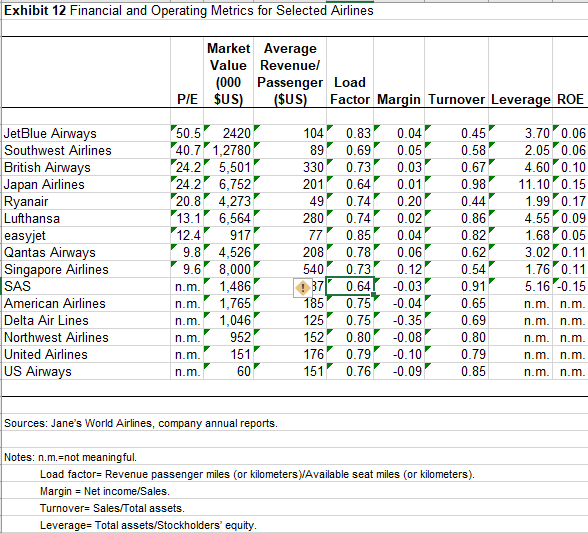
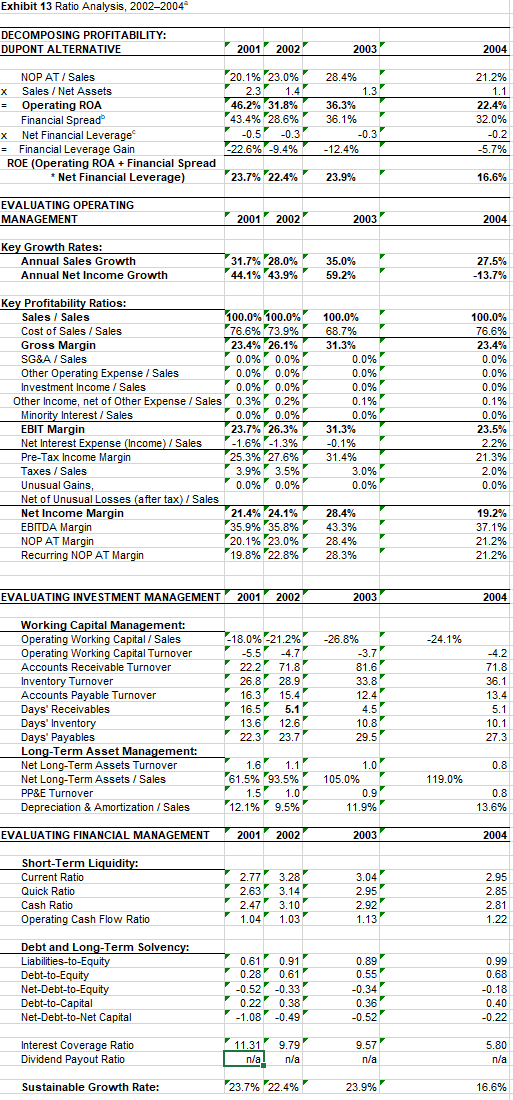
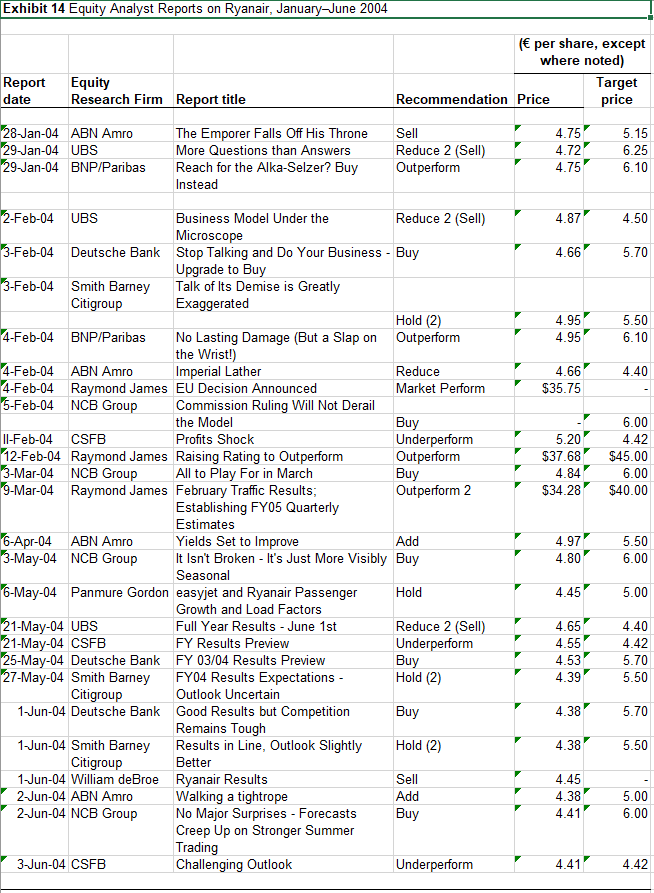
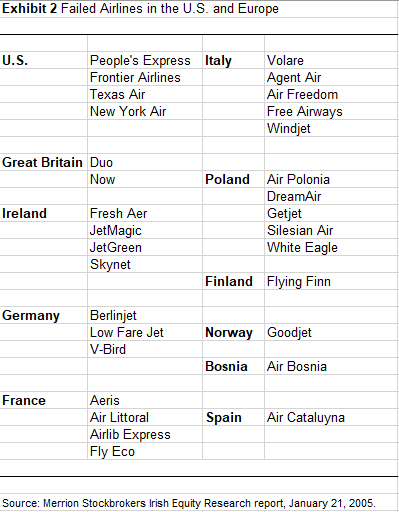
Taxation Corporation tax paid (2,056) (3,410) (5,071) Capital expenditure Purchase of tangible fixed assets Sale of tangible fixed assets Net cash (outflow) from capital expenditure (331,603) (469,878) (372,587) 31 563 (331,599) (469,847) (372,024) 13) (469,878) Acquisitions Purchase consideration Onerous lease payments Net cash (outflow) from acquisition of subsidiary undertakings (20,795) (11,901) (32,696) 75,398 (121,646) (57,626) Net cash inflowl(outflow) before financing and management of liquid resources Financing Loans raised Loans repaid Issue of share capital Share issue costs Capital element of finance leases Net cash inflow from financing 187,035 331,502 175,746 (71,278) (44,779) (27,886) 6,948 56 188,331 (6,330) (1) (107) 122,705 286,778 329,754 Management of liquid resources (Increase) in liquid resources (249,220) (166,329) (251,241) (126,515) 120,449 78,513 Net cash (outflow)/inflow from financing and management of liquid resources Increase (decrease) in cash (51,117) (1,197) 20,887 Consolidated Statement of Changes in Shareholders' Funds-equity (all amounts in 000) Called-up Share Profit share premium and loss capital account account Total 9,587 553,457 439,230 1,002,274 55 56 239,398 239,398 Balance at March 31, 2002 Issue of ordinary equity shares (net of issue costs) Profit for the financial year Balance at March 31, 2003 Issue of ordinary equity shares Profit for the financial year 9,588 553,512 678,628 1,241,728 55 6,894 6,949 206,611 206,611 Balance at March 31, 2004 9,643 560,406 885,239 1,455,288 Exhibit 6 Supplemental revenue information (000) Ancillary revenues comprise: 2004 2003 Nonflight scheduled Car Hire Inflight Internet income Charter 66,616 35,110 30,100 17,721 111 149.658 35,291 27,615 23,142 12,159 12.350 110.557 Source: 2004 Ryanair annual report. Exhibit 7 Supplemental cost information (000) Staff Number and Costs Average weekly number of employees, including the executive director, during the year, analyzed by category: 2004 2003 Flight and cabin crew Sales, operations and administration 1,530 758 2,288 983 763 1,746 Aggregate payroll costs of these persons: 2004 2003 Wages, salaries and related costs Social welfare costs Other pension costs 112,258 82,633 9,660 7,835 1,706 2,605 123,624 93,073 Other Operating Expenses Other operating expenses comprise: 2004 2003 Fuel and oil Airport and handling charges Route charges Maintenance, materials and repairs Marketing and distribution costs Aircraft rentals Other costs 174,991 128,842 147,221 107,994 110,27168,406 43,420 29,709 16,141 14,623 11,541 78,034 59,522 582,619 409,096 Exceptional costs Aircraft rentals Buzz reorganization 13,291 3,012 16,303 597,922 409,096 Exhibit 8 Summary of Differences between Irish/United Kingdom and U.S. GAAP (000) 2004 2003 2002 Profit for financial year as reported in the consolidated profit and loss account and in accordance with Irish and U.K. GAAP 206,611 239,398 150,375 751 Adjustments Pensions Derivative financial instruments (net of tax) Amortisation of goodwill Employment grants Capitalised interest regarding aircraft acquisition programme Darley Investments Limited Taxation - effect of above adjustments Net income in accordance with U.S. GAAP 89 697 (4,189) 2,342 469 7,213 5,262 88 88 (913) 85 215,430 241,810 464 5,027 88 (1,156) 155,549 Total assets as reported in the consolidated balance sheets and in accordance with Irish and U.K. GAAP 2,938,998 2,466,707 1,889,572 Adjustments Pensions Amortisation of goodwill Capitalised interest regarding aircraft acquisition programme Darley Investments Limited Total assets as adjusted to accord with U.S. GAAP 3,200 3,111 2,414 2,342 17,502 10,289 5,027 (151) (239) (327) 2,961,891 2,479,868 1,896,686 Shareholders' equity as reported in the consolidated balance sheets and in accordance with Irish and U.K. GAAP 1,455,288 1,241,728 1,002,274 Adjustments Pension Amortisation of goodwill Employment grants Capitalised interest regarding aircraft acquisition programme Darley Investments Limited Minimum pension liability (net of tax) Unrealised (losses) on derivative financial instruments (net of tax) Tax effect of adjustments (excluding pension and derivative adjustments) Shareholders' equity as adjusted to accord with U.S. GAAP 3,200 3,111 2,414 2,342 (469) 17,502 10,289 5,027 (151) (239) (327) (2,631) (2,656) (116,681) (73,371) 12,448 (2,588) (1,675) (1,760) 1,356,281 1,177,187 1,019,607 Exhibit 12 Financial and Operating Metrics for Selected Airlines Market Average Value Revenuel (000 Passenger Load P/E $US) ($US) Factor Margin Turnover Leverage ROE 0.83 JetBlue Airways Southwest Airlines British Airways Japan Airlines Ryanair Lufthansa easyjet Qantas Airways Singapore Airlines SAS American Airlines Delta Air Lines Northwest Airlines United Airlines US Airways 50.5' 2420 40.7' 1,2780 24.2' 5,501 24.2' 6,752 20.8 4,273 13.1 6,5641 124 917 9.8 4,526 9.6 8,000 n.m. 1,486 n.m. 1,765 n.m. 1,046 n.m. 952 n.m. 151 n.m. 60 104 89 330 201 49 280 77 208 540 87 185 125 152 176 151 0.69 0.73 0.64 0.74 0.74 0.85 0.78 0.73 0.64 0.75 0.75 0.80 0.79 0.76 0.04 0.05 0.03 0.01 0.20 0.02 0.04 0.06 0.12 -0.03 -0.04 -0.35 -0.08 -0.10 -0.09 0.45 0.58 0.67 0.98 0.44 0.86 0.82 0.62 0.54 0.91 0.65 0.69 0.80 0.79 0.85 3.700.06 2.05 0.06 4.60 0.10 11.10 0.15 1.99 0.17 4.55 0.09 1.68 0.05 3.02 0.11 1.76 0.11 5.16 -0.15 n.m. n.m. n.m. n.m. n.m. n.m n.m. n.m. n.m. n.m. Sources: Jane's World Airlines, company annual reports. Notes: n.m.=not meaningful. Load factor= Revenue passenger miles (or kilometers Available seat miles (or kilometers). Margin = Net income/Sales. Turnover= Sales/Total assets. Leverage- Total assets/Stockholders' equity. Exhibit 13 Ratio Analysis, 2002-2004 DECOMPOSING PROFITABILITY: DUPONT ALTERNATIVE 2001 2002' 2003 2004 NOP AT / Sales x Sales / Net Assets = Operating ROA Financial Spread x Net Financial Leverage = Financial Leverage Gain ROE (Operating ROA + Financial Spread * Net Financial Leverage) 20.1% 23.0% 2.3 1.47 46.2% 31.8% 43.4% 28.6% -0.5' -0.37 -22.6% -9.4% 28.4% 1.3 36.3% 36.1% -0.37 -12.4% 21.2% 1.1 22.4% 32.0% -0.2 -5.7% 23.7% 22.4% 23.9% 16.6% EVALUATING OPERATING MANAGEMENT 2001/2002 2003 2004 Key Growth Rates: Annual Sales Growth Annual Net Income Growth 31.7% 28.0% 44.1% 43.9% 35.0% 59.2% 27.5% -13.7% Key Profitability Ratios: Sales / Sales 100.0% 100.0% Cost of Sales / Sales 76.6% 73.9% Gross Margin 23.4% 26.1% SG&A / Sales 0.0% 0.0% Other Operating Expense / Sales 0.0% 0.0% Investment Income / Sales 0.0% 0.0% Other Income, net of Other Expense / Sales 0.3% 0.2% Minority Interest / Sales 0.0% 0.0% EBIT Margin 23.7% 26.3% Net Interest Expense (Income) / Sales -1.6% -1.3% Pre-Tax Income Margin 25.3% 27.6% Taxes / Sales 3.9% 3.5% Unusual Gains, 0.0% 0.0% Net of Unusual Losses (after tax) / Sales Net Income Margin 21.4% 24.1% % EBITDA Margin 35.9% 35.8% NOP AT Margin 20.1% 23.0% Recurring NOP AT Margin 19.8% 22.8% 100.0% 68.7% 31.3% 0.0% 0.0% 0.0% 0.1% 0.0% 31.3% -0.1% 31.4% 100.0% 76.6% 23.4% 0.0% 0.0% 0.0% 0.1% 0.0% % 23.5% 2.2% 21.3% 2.0% 0.0% 3.0% 0.0% 28.4% 43.3% 28.4% 28.3% 19.2% 37.1% 21.2% 21.2% EVALUATING INVESTMENT MANAGEMENT 2001 2002 2003 2004 -24.1% -26.8% -3.7 81.6 -18.0% -21.2% -5.5' -4.77 22.2' 71.87 26.8' 28.9 16.3' 15.4 16.55.17 13.6 12.6 22.3' 23.7' 33.8 12.4 Working Capital Management: Operating Working Capital / Sales Operating Working Capital Turnover Accounts Receivable Turnover Inventory Turnover Accounts Payable Turnover Days' Receivables Days' Inventory Days' Payables Long-Term Asset Management: Net Long-Term Assets Turnover Net Long-Term Assets / Sales PP&E Turnover Depreciation & Amortization / Sales -4.2 71.8 36.1 13.4 5.1 10.1 27.3 4.5 10.87 29.5 0.8 119.0% 1.6 1.1 1.07 61.5% 93.5%' 105.0% 1.5 1.07 0.9 12.1%' 9.5% 11.9% 0.8 13.6% EVALUATING FINANCIAL MANAGEMENT 2001 2002 2003 2004 Short-Term Liquidity: Current Ratio Quick Ratio Cash Ratio Operating Cash Flow Ratio 2.77' 3.28 2.63' 3.147 2.47' 3.10 1.04' 1.03 3.04 2.95 2.95 2.85 2.81 1.22 2.92 1.13 Debt and Long-Term Solvency: Liabilities-to-Equity Debt-to-Equity Net-Debt-to-Equity Debt-to-Capital Net-Debt-to-Net Capital 0.61' 0.91 0.28 0.61 -0.52' -0.33 0.22' 0.38 -1.08 -0.49 0.89 0.55 -0.34 0.36 -0.52 0.99 0.68 -0.18 0.40 -0.22 Interest Coverage Ratio Dividend Payout Ratio 11.31 n/a 9.79 n/a 9.57 n/a a 5.80 n/a Sustainable Growth Rate: 23.7% 22.4% 23.9% 16.6% Exhibit 14 Equity Analyst Reports on Ryanair, January-June 2004 ( per share, except where noted) Target Recommendation Price price Report date Equity Research Firm Report title 4.75 28-Jan-04 ABN Amro 29-Jan-04 UBS 29-Jan-04 BNP/Paribas The Emporer Falls Off His Throne More Questions than Answers Reach for the Alka-Selzer? Buy Instead Sell Reduce 2 (Sell) Outperform 4.72 4.75 5.15 6.25 6.10 4.87' 4.50 4.66 5.70 4.95 4.95 5.50 6.10 4.40 4.66 $35.75 5.20 $37.68 4.84 $34.28 6.00 4.42 $45.00 6.00 $40.00 2-Feb-04 UBS Business Model Under the Reduce 2 (Sell) Microscope 3-Feb-04 Deutsche Bank Stop Talking and Do Your Business - Buy Upgrade to Buy 3-Feb-04 Smith Barney Talk of Its Demise is Greatly Citigroup Exaggerated Hold (2) 4-Feb-04 BNP/Paribas No Lasting Damage (But a Slap on Outperform the Wrist!) 4-Feb-04 ABN Amro Imperial Lather Reduce 4-Feb-04 Raymond James EU Decision Announced Market Perform 5-Feb-04 NCB Group Commission Ruling Will Not Derail the Model Buy Il-Feb-04 CSFB Profits Shock Underperform 12-Feb-04 Raymond James Raising Rating to Outperform Outperform 3-Mar-04 NCB Group All to Play For in March Buy 9-Mar-04 Raymond James February Traffic Results; Outperform 2 Establishing FY05 Quarterly Estimates 6-Apr-04 ABN Amro Yields Set to Improve Add 3-May-04 NCB Group It Isn't Broken - It's Just More Visibly Buy Seasonal 6-May-04 Panmure Gordon easyjet and Ryanair Passenger Hold Growth and Load Factors 21-May-04 UBS Full Year Results - June 1st Reduce 2 (Sell) 21-May-04 CSFB FY Results Previc Underperform 25-May-04 Deutsche Bank FY 03/04 Results Preview Buy 27-May-04 Smith Barney FY04 Results Expectations - Hold (2) Citigroup Outlook Uncertain 1-Jun-04 Deutsche Bank Good Results but Competition Buy Remains Tough 1-Jun-04 Smith Barney Results in Line, Outlook Slightly Hold (2) Citigroup Better 1-Jun-04 William deBroe Ryanair Results Sell 2-Jun-04 ABN Amro Walking a tightrope Add 2-Jun-04 NCB Group No Major Surprises - Forecasts Buy Creep Up on Stronger Summer Trading 3-Jun-04 CSFB Challenging Outlook Underperform 4.971 4.80 5.50 6.00 4.45 5.00 4.65 4.55 4.53 4.39 4.40 4.42 5.70 5.50 4.38 5.70 4.38 5.50 4.45 4.38 4.41 5.00 6.00 4.41 4.42 Exhibit 2 Failed Airlines in the U.S. and Europe U.S. People's Express Italy Frontier Airlines Texas Air New York Air Volare Agent Air Air Freedom Free Airways Windjet Great Britain Duo Now Ireland Fresh Aer JetMagic Jet Green Skynet Poland Air Polonia DreamAir Getjet Silesian Air White Eagle Finland Flying Finn Germany Berlinjet Low Fare Jet V-Bird Norway Goodjet Bosnia Air Bosnia France Aeris Air Littoral Airlib Express Spain Air Cataluyna Fly Eco Source: Merrion Stockbrokers Irish Equity Research report, January 21, 2005. Taxation Corporation tax paid (2,056) (3,410) (5,071) Capital expenditure Purchase of tangible fixed assets Sale of tangible fixed assets Net cash (outflow) from capital expenditure (331,603) (469,878) (372,587) 31 563 (331,599) (469,847) (372,024) 13) (469,878) Acquisitions Purchase consideration Onerous lease payments Net cash (outflow) from acquisition of subsidiary undertakings (20,795) (11,901) (32,696) 75,398 (121,646) (57,626) Net cash inflowl(outflow) before financing and management of liquid resources Financing Loans raised Loans repaid Issue of share capital Share issue costs Capital element of finance leases Net cash inflow from financing 187,035 331,502 175,746 (71,278) (44,779) (27,886) 6,948 56 188,331 (6,330) (1) (107) 122,705 286,778 329,754 Management of liquid resources (Increase) in liquid resources (249,220) (166,329) (251,241) (126,515) 120,449 78,513 Net cash (outflow)/inflow from financing and management of liquid resources Increase (decrease) in cash (51,117) (1,197) 20,887 Consolidated Statement of Changes in Shareholders' Funds-equity (all amounts in 000) Called-up Share Profit share premium and loss capital account account Total 9,587 553,457 439,230 1,002,274 55 56 239,398 239,398 Balance at March 31, 2002 Issue of ordinary equity shares (net of issue costs) Profit for the financial year Balance at March 31, 2003 Issue of ordinary equity shares Profit for the financial year 9,588 553,512 678,628 1,241,728 55 6,894 6,949 206,611 206,611 Balance at March 31, 2004 9,643 560,406 885,239 1,455,288 Exhibit 6 Supplemental revenue information (000) Ancillary revenues comprise: 2004 2003 Nonflight scheduled Car Hire Inflight Internet income Charter 66,616 35,110 30,100 17,721 111 149.658 35,291 27,615 23,142 12,159 12.350 110.557 Source: 2004 Ryanair annual report. Exhibit 7 Supplemental cost information (000) Staff Number and Costs Average weekly number of employees, including the executive director, during the year, analyzed by category: 2004 2003 Flight and cabin crew Sales, operations and administration 1,530 758 2,288 983 763 1,746 Aggregate payroll costs of these persons: 2004 2003 Wages, salaries and related costs Social welfare costs Other pension costs 112,258 82,633 9,660 7,835 1,706 2,605 123,624 93,073 Other Operating Expenses Other operating expenses comprise: 2004 2003 Fuel and oil Airport and handling charges Route charges Maintenance, materials and repairs Marketing and distribution costs Aircraft rentals Other costs 174,991 128,842 147,221 107,994 110,27168,406 43,420 29,709 16,141 14,623 11,541 78,034 59,522 582,619 409,096 Exceptional costs Aircraft rentals Buzz reorganization 13,291 3,012 16,303 597,922 409,096 Exhibit 8 Summary of Differences between Irish/United Kingdom and U.S. GAAP (000) 2004 2003 2002 Profit for financial year as reported in the consolidated profit and loss account and in accordance with Irish and U.K. GAAP 206,611 239,398 150,375 751 Adjustments Pensions Derivative financial instruments (net of tax) Amortisation of goodwill Employment grants Capitalised interest regarding aircraft acquisition programme Darley Investments Limited Taxation - effect of above adjustments Net income in accordance with U.S. GAAP 89 697 (4,189) 2,342 469 7,213 5,262 88 88 (913) 85 215,430 241,810 464 5,027 88 (1,156) 155,549 Total assets as reported in the consolidated balance sheets and in accordance with Irish and U.K. GAAP 2,938,998 2,466,707 1,889,572 Adjustments Pensions Amortisation of goodwill Capitalised interest regarding aircraft acquisition programme Darley Investments Limited Total assets as adjusted to accord with U.S. GAAP 3,200 3,111 2,414 2,342 17,502 10,289 5,027 (151) (239) (327) 2,961,891 2,479,868 1,896,686 Shareholders' equity as reported in the consolidated balance sheets and in accordance with Irish and U.K. GAAP 1,455,288 1,241,728 1,002,274 Adjustments Pension Amortisation of goodwill Employment grants Capitalised interest regarding aircraft acquisition programme Darley Investments Limited Minimum pension liability (net of tax) Unrealised (losses) on derivative financial instruments (net of tax) Tax effect of adjustments (excluding pension and derivative adjustments) Shareholders' equity as adjusted to accord with U.S. GAAP 3,200 3,111 2,414 2,342 (469) 17,502 10,289 5,027 (151) (239) (327) (2,631) (2,656) (116,681) (73,371) 12,448 (2,588) (1,675) (1,760) 1,356,281 1,177,187 1,019,607 Exhibit 12 Financial and Operating Metrics for Selected Airlines Market Average Value Revenuel (000 Passenger Load P/E $US) ($US) Factor Margin Turnover Leverage ROE 0.83 JetBlue Airways Southwest Airlines British Airways Japan Airlines Ryanair Lufthansa easyjet Qantas Airways Singapore Airlines SAS American Airlines Delta Air Lines Northwest Airlines United Airlines US Airways 50.5' 2420 40.7' 1,2780 24.2' 5,501 24.2' 6,752 20.8 4,273 13.1 6,5641 124 917 9.8 4,526 9.6 8,000 n.m. 1,486 n.m. 1,765 n.m. 1,046 n.m. 952 n.m. 151 n.m. 60 104 89 330 201 49 280 77 208 540 87 185 125 152 176 151 0.69 0.73 0.64 0.74 0.74 0.85 0.78 0.73 0.64 0.75 0.75 0.80 0.79 0.76 0.04 0.05 0.03 0.01 0.20 0.02 0.04 0.06 0.12 -0.03 -0.04 -0.35 -0.08 -0.10 -0.09 0.45 0.58 0.67 0.98 0.44 0.86 0.82 0.62 0.54 0.91 0.65 0.69 0.80 0.79 0.85 3.700.06 2.05 0.06 4.60 0.10 11.10 0.15 1.99 0.17 4.55 0.09 1.68 0.05 3.02 0.11 1.76 0.11 5.16 -0.15 n.m. n.m. n.m. n.m. n.m. n.m n.m. n.m. n.m. n.m. Sources: Jane's World Airlines, company annual reports. Notes: n.m.=not meaningful. Load factor= Revenue passenger miles (or kilometers Available seat miles (or kilometers). Margin = Net income/Sales. Turnover= Sales/Total assets. Leverage- Total assets/Stockholders' equity. Exhibit 13 Ratio Analysis, 2002-2004 DECOMPOSING PROFITABILITY: DUPONT ALTERNATIVE 2001 2002' 2003 2004 NOP AT / Sales x Sales / Net Assets = Operating ROA Financial Spread x Net Financial Leverage = Financial Leverage Gain ROE (Operating ROA + Financial Spread * Net Financial Leverage) 20.1% 23.0% 2.3 1.47 46.2% 31.8% 43.4% 28.6% -0.5' -0.37 -22.6% -9.4% 28.4% 1.3 36.3% 36.1% -0.37 -12.4% 21.2% 1.1 22.4% 32.0% -0.2 -5.7% 23.7% 22.4% 23.9% 16.6% EVALUATING OPERATING MANAGEMENT 2001/2002 2003 2004 Key Growth Rates: Annual Sales Growth Annual Net Income Growth 31.7% 28.0% 44.1% 43.9% 35.0% 59.2% 27.5% -13.7% Key Profitability Ratios: Sales / Sales 100.0% 100.0% Cost of Sales / Sales 76.6% 73.9% Gross Margin 23.4% 26.1% SG&A / Sales 0.0% 0.0% Other Operating Expense / Sales 0.0% 0.0% Investment Income / Sales 0.0% 0.0% Other Income, net of Other Expense / Sales 0.3% 0.2% Minority Interest / Sales 0.0% 0.0% EBIT Margin 23.7% 26.3% Net Interest Expense (Income) / Sales -1.6% -1.3% Pre-Tax Income Margin 25.3% 27.6% Taxes / Sales 3.9% 3.5% Unusual Gains, 0.0% 0.0% Net of Unusual Losses (after tax) / Sales Net Income Margin 21.4% 24.1% % EBITDA Margin 35.9% 35.8% NOP AT Margin 20.1% 23.0% Recurring NOP AT Margin 19.8% 22.8% 100.0% 68.7% 31.3% 0.0% 0.0% 0.0% 0.1% 0.0% 31.3% -0.1% 31.4% 100.0% 76.6% 23.4% 0.0% 0.0% 0.0% 0.1% 0.0% % 23.5% 2.2% 21.3% 2.0% 0.0% 3.0% 0.0% 28.4% 43.3% 28.4% 28.3% 19.2% 37.1% 21.2% 21.2% EVALUATING INVESTMENT MANAGEMENT 2001 2002 2003 2004 -24.1% -26.8% -3.7 81.6 -18.0% -21.2% -5.5' -4.77 22.2' 71.87 26.8' 28.9 16.3' 15.4 16.55.17 13.6 12.6 22.3' 23.7' 33.8 12.4 Working Capital Management: Operating Working Capital / Sales Operating Working Capital Turnover Accounts Receivable Turnover Inventory Turnover Accounts Payable Turnover Days' Receivables Days' Inventory Days' Payables Long-Term Asset Management: Net Long-Term Assets Turnover Net Long-Term Assets / Sales PP&E Turnover Depreciation & Amortization / Sales -4.2 71.8 36.1 13.4 5.1 10.1 27.3 4.5 10.87 29.5 0.8 119.0% 1.6 1.1 1.07 61.5% 93.5%' 105.0% 1.5 1.07 0.9 12.1%' 9.5% 11.9% 0.8 13.6% EVALUATING FINANCIAL MANAGEMENT 2001 2002 2003 2004 Short-Term Liquidity: Current Ratio Quick Ratio Cash Ratio Operating Cash Flow Ratio 2.77' 3.28 2.63' 3.147 2.47' 3.10 1.04' 1.03 3.04 2.95 2.95 2.85 2.81 1.22 2.92 1.13 Debt and Long-Term Solvency: Liabilities-to-Equity Debt-to-Equity Net-Debt-to-Equity Debt-to-Capital Net-Debt-to-Net Capital 0.61' 0.91 0.28 0.61 -0.52' -0.33 0.22' 0.38 -1.08 -0.49 0.89 0.55 -0.34 0.36 -0.52 0.99 0.68 -0.18 0.40 -0.22 Interest Coverage Ratio Dividend Payout Ratio 11.31 n/a 9.79 n/a 9.57 n/a a 5.80 n/a Sustainable Growth Rate: 23.7% 22.4% 23.9% 16.6% Exhibit 14 Equity Analyst Reports on Ryanair, January-June 2004 ( per share, except where noted) Target Recommendation Price price Report date Equity Research Firm Report title 4.75 28-Jan-04 ABN Amro 29-Jan-04 UBS 29-Jan-04 BNP/Paribas The Emporer Falls Off His Throne More Questions than Answers Reach for the Alka-Selzer? Buy Instead Sell Reduce 2 (Sell) Outperform 4.72 4.75 5.15 6.25 6.10 4.87' 4.50 4.66 5.70 4.95 4.95 5.50 6.10 4.40 4.66 $35.75 5.20 $37.68 4.84 $34.28 6.00 4.42 $45.00 6.00 $40.00 2-Feb-04 UBS Business Model Under the Reduce 2 (Sell) Microscope 3-Feb-04 Deutsche Bank Stop Talking and Do Your Business - Buy Upgrade to Buy 3-Feb-04 Smith Barney Talk of Its Demise is Greatly Citigroup Exaggerated Hold (2) 4-Feb-04 BNP/Paribas No Lasting Damage (But a Slap on Outperform the Wrist!) 4-Feb-04 ABN Amro Imperial Lather Reduce 4-Feb-04 Raymond James EU Decision Announced Market Perform 5-Feb-04 NCB Group Commission Ruling Will Not Derail the Model Buy Il-Feb-04 CSFB Profits Shock Underperform 12-Feb-04 Raymond James Raising Rating to Outperform Outperform 3-Mar-04 NCB Group All to Play For in March Buy 9-Mar-04 Raymond James February Traffic Results; Outperform 2 Establishing FY05 Quarterly Estimates 6-Apr-04 ABN Amro Yields Set to Improve Add 3-May-04 NCB Group It Isn't Broken - It's Just More Visibly Buy Seasonal 6-May-04 Panmure Gordon easyjet and Ryanair Passenger Hold Growth and Load Factors 21-May-04 UBS Full Year Results - June 1st Reduce 2 (Sell) 21-May-04 CSFB FY Results Previc Underperform 25-May-04 Deutsche Bank FY 03/04 Results Preview Buy 27-May-04 Smith Barney FY04 Results Expectations - Hold (2) Citigroup Outlook Uncertain 1-Jun-04 Deutsche Bank Good Results but Competition Buy Remains Tough 1-Jun-04 Smith Barney Results in Line, Outlook Slightly Hold (2) Citigroup Better 1-Jun-04 William deBroe Ryanair Results Sell 2-Jun-04 ABN Amro Walking a tightrope Add 2-Jun-04 NCB Group No Major Surprises - Forecasts Buy Creep Up on Stronger Summer Trading 3-Jun-04 CSFB Challenging Outlook Underperform 4.971 4.80 5.50 6.00 4.45 5.00 4.65 4.55 4.53 4.39 4.40 4.42 5.70 5.50 4.38 5.70 4.38 5.50 4.45 4.38 4.41 5.00 6.00 4.41 4.42 Exhibit 2 Failed Airlines in the U.S. and Europe U.S. People's Express Italy Frontier Airlines Texas Air New York Air Volare Agent Air Air Freedom Free Airways Windjet Great Britain Duo Now Ireland Fresh Aer JetMagic Jet Green Skynet Poland Air Polonia DreamAir Getjet Silesian Air White Eagle Finland Flying Finn Germany Berlinjet Low Fare Jet V-Bird Norway Goodjet Bosnia Air Bosnia France Aeris Air Littoral Airlib Express Spain Air Cataluyna Fly Eco Source: Merrion Stockbrokers Irish Equity Research report, January 21, 2005