

Question
determine if there are differences among educators from the four Program Areas (English, French, Biology, or Physics) on their knowledge posttest marks (at the end
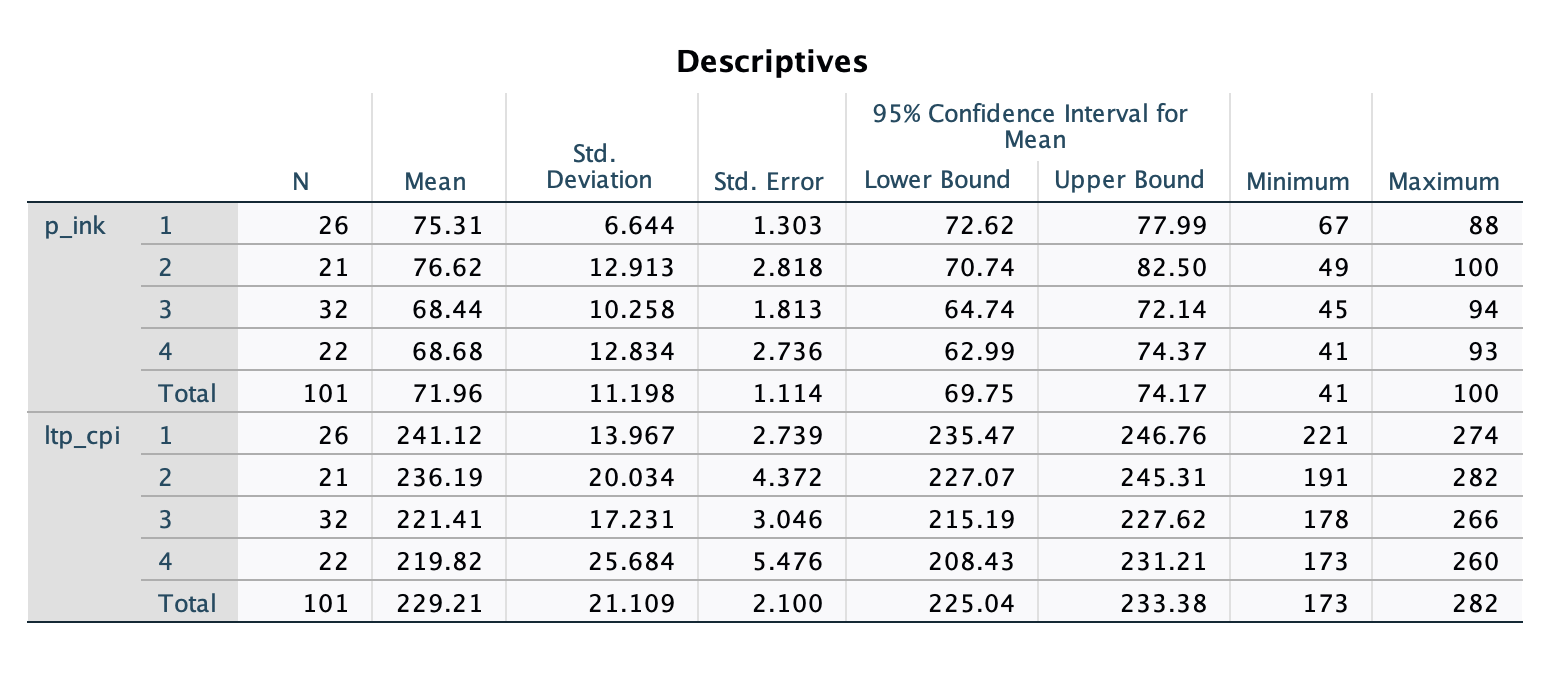

determine if there are differences among educators from the four Program Areas (English, French, Biology, or Physics) on their knowledge "posttest" marks (at the end of the workshop). Also, are there differences for the four groups on their "long-term" composite performance indicator marks administered a month after the workshop?
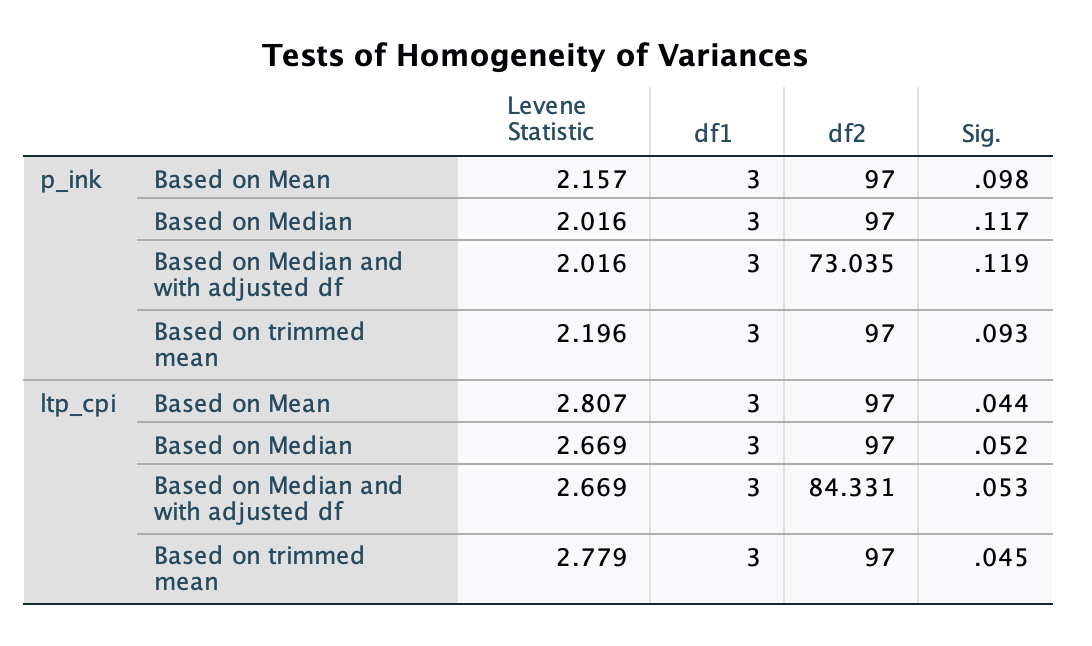
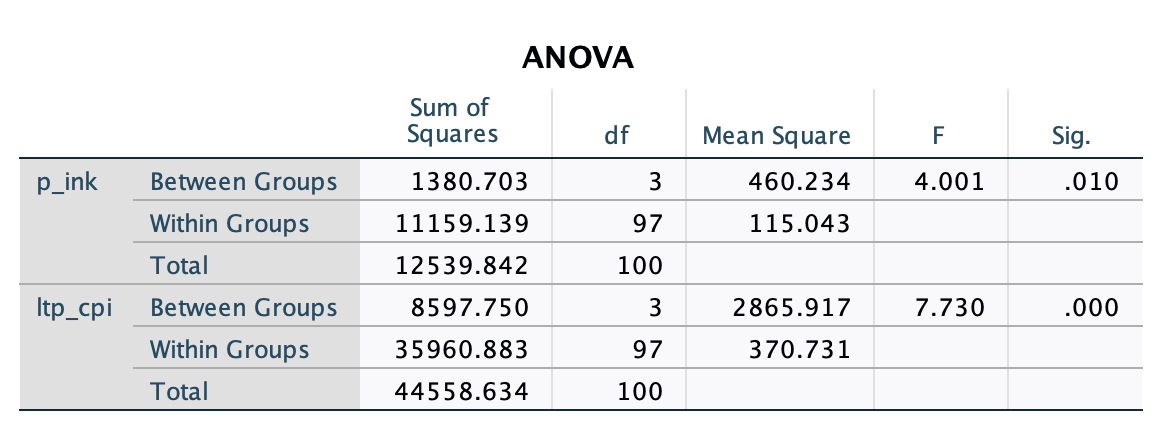
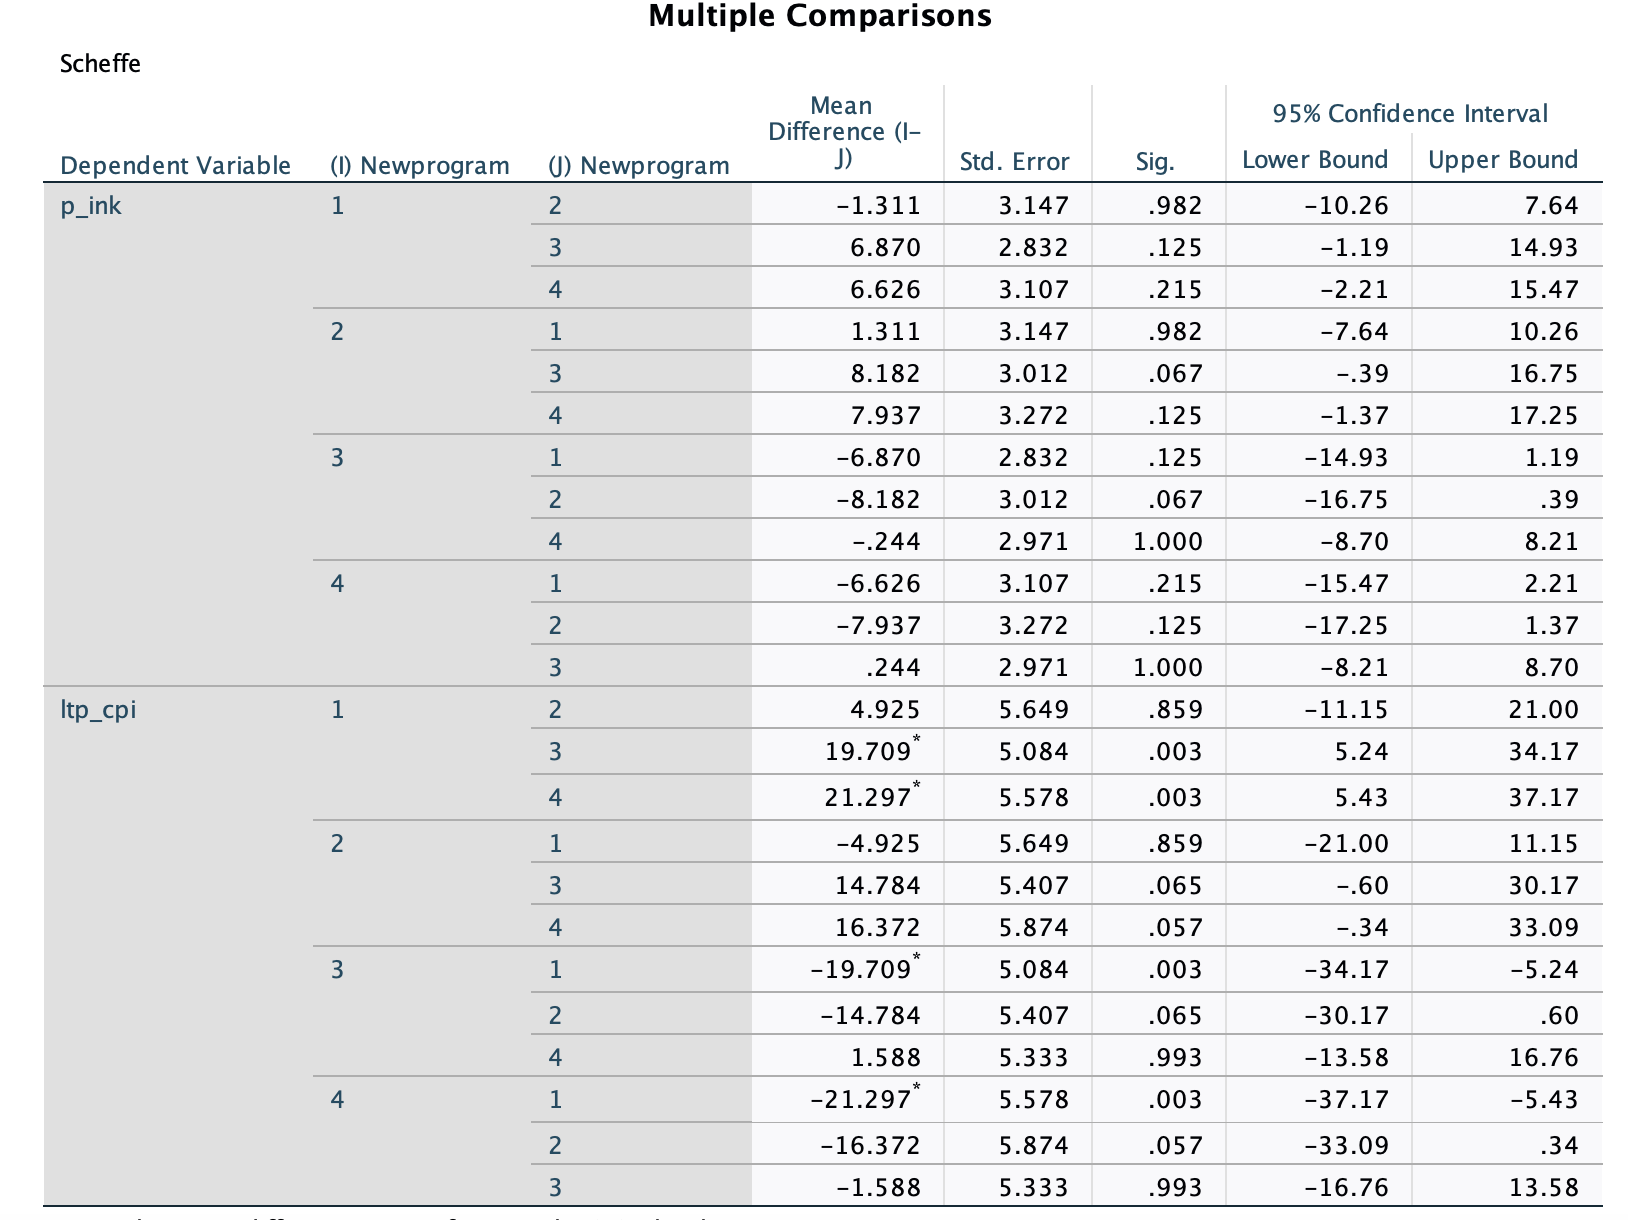
Again, use analysis of variance (ANOVA) and theF-test to determine if there were overall differences in means, and if there were differences, between which groups these differences occur. Conduct the analyses for both the knowledge posttest and the long-term composite performance indicator for educators in the workshop.


Step by Step Solution
There are 3 Steps involved in it
Step: 1

Get Instant Access to Expert-Tailored Solutions
See step-by-step solutions with expert insights and AI powered tools for academic success
Step: 2

Step: 3
Ace Your Homework with AI
Get the answers you need in no time with our AI-driven, step-by-step assistance
Get Started
Discrete Structures, Logic, And Computability
Authors: James L Hein
3rd Edition
1449615279, 9781449615277